Volume Analysis | Flash Update – 11.9.26

A Tale of Two Markets: Part 2 The Track of the Storm
By Buff Dormeier, CMT
Chief Technical Analyst, Kingsview Investment Management
It was a week of advancing hopes and retreating armies. The Old Era city began by pressing its advantage, while the New Era city struggled to repair its defenses. By Thursday, however, the battle was no longer confined to one side of the market. The generals lost a critical position, and the shock traveled through the ranks.
Our adaptation of Charles Dickens’s A Tale of Two Cities has now entered a more demanding chapter. October told the story of a change of command. November’s opening week asked whether the replacement leaders could withstand an increasingly disorderly retreat by their former commanders. The answer, at least this week, was that relative resilience provided shelter, but not immunity.
Our original “Doji Know?” observations helped frame October’s leadership reversal. The generals hesitated near resistance while the dividend brass and equal weight lieutenants tested support. The ensuing change was meaningful. But identifying a successful handoff did not eliminate the risk that selling could eventually overwhelm the receiving formations. As last week’s field report cautioned, a disorderly breakdown among the largest companies could still threaten the units gaining ground elsewhere.
Last Week’s Marching Orders, This Week’s Battle Damage
Last week’s assignments were explicit. The S&P 500 needed to defend 7,500 and reclaim its 50-day moving average. The generals needed to preserve 685 and the rising trend support near 680. The troops needed to establish themselves above 280 rather than repeatedly contest it. Meanwhile, the broader formations needed to maintain their advances, with improving participation eventually accompanied by stabilizing capital sponsorship.
Those were not decorative lines on a map. They were the positions separating an orderly rotation from a more consequential deterioration.
Initially, the broader ranks continued carrying out their orders. The equal-weight lieutenants pressed higher, the dividend brass challenged new ground, and the troops surged in Wednesday’s advance. The generals remained the weakest formation, briefly recovering to positive territory by mid-week. Then Thursday changed the campaign. The new era technology-heavy leadership tumbled, the S&P 500 surrendered 7,500, and every regiment in our weekly comparison fell into negative territory.
The two cities had been experiencing different fortunes. Suddenly, both met the same heavy artillery.
The Track of a Storm
Dickens titled the third book of his novel “The Track of a Storm.” That description fits the sequence of our recent volume reports: first the warning, then the pressure, and finally a breach in the defenses.
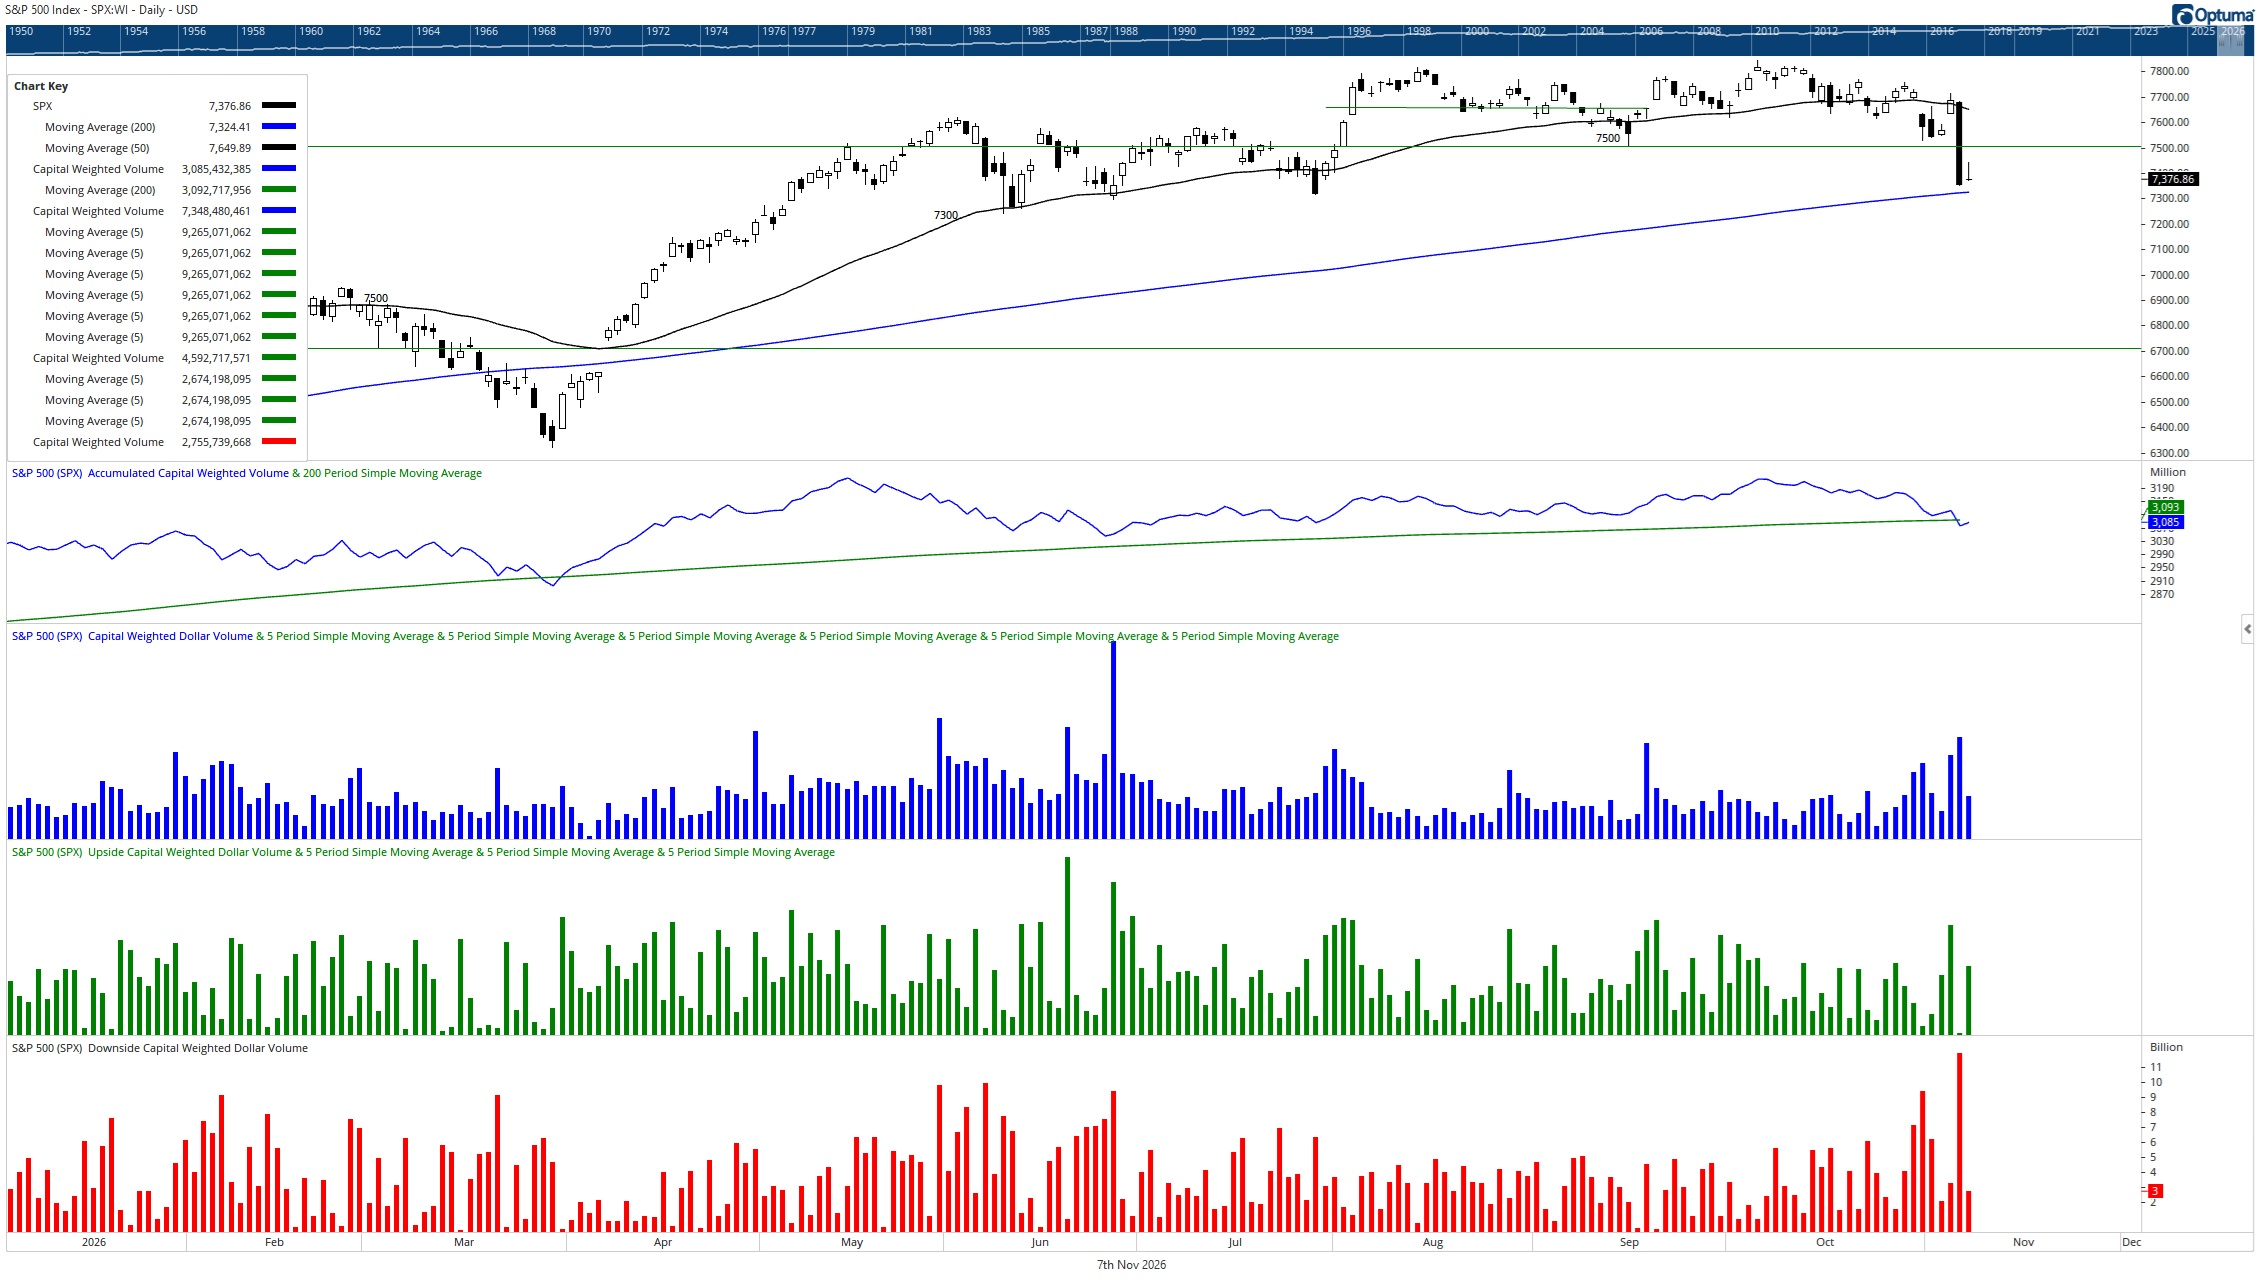
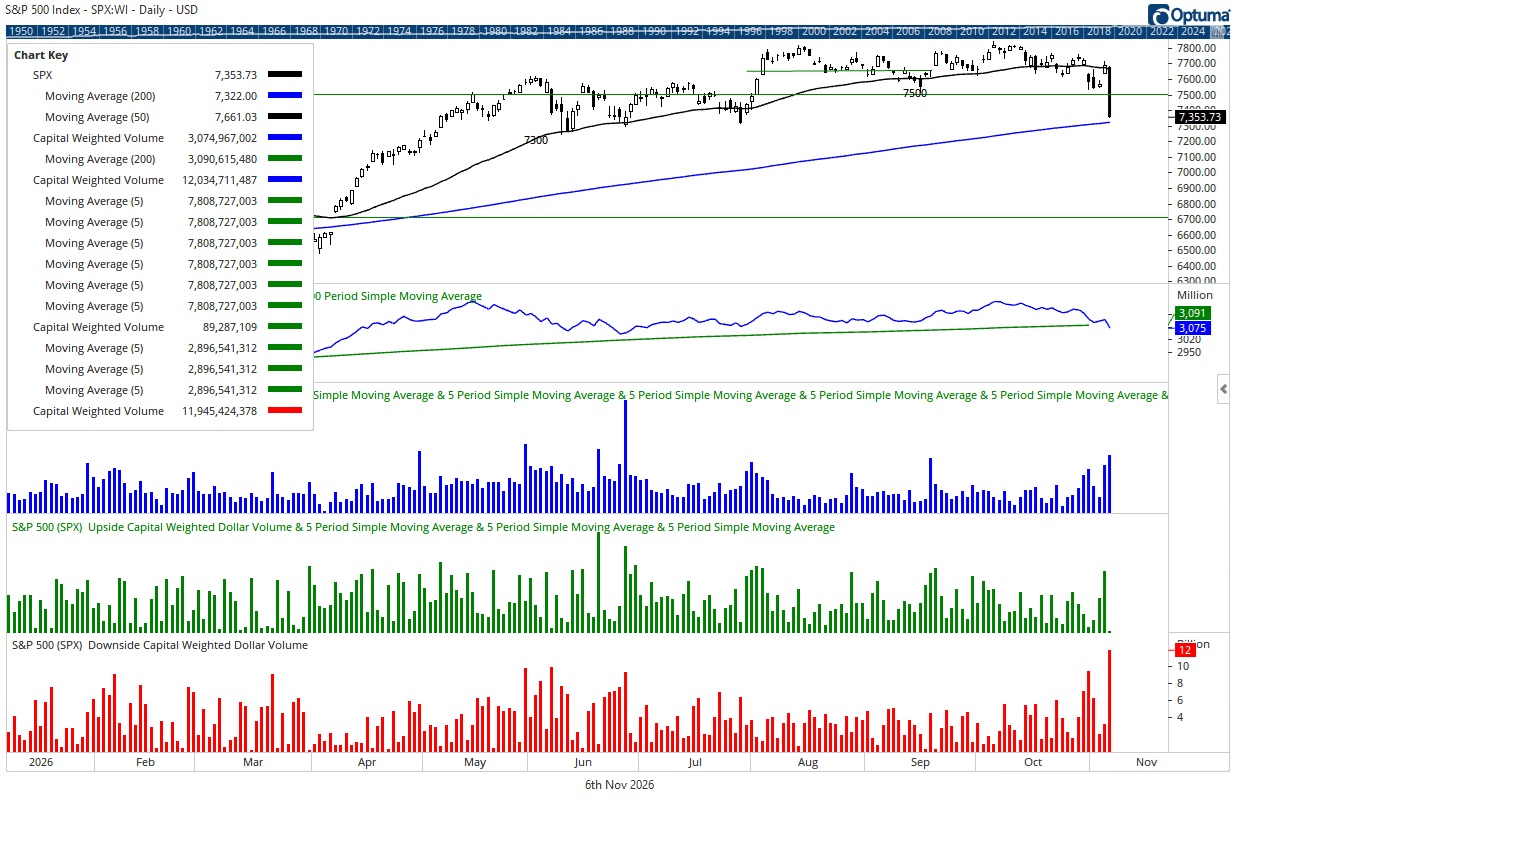
The previous Friday (10/30) closed on a 93% downside Capital Weighted Volume day, warning that the bears were gaining force. Thursday, November 5, delivered a substantially more severe onslaught. Our research tally registered the largest daily downside S&P 500 Capital Weighted Volume day in our historical series, with 99.6% of that activity directed to the downside.
This distinction matters because together they describe the direction of our capital-weighted trading measure. It was not just 99.6% of stocks declined. Nor did an insignificant share of invested capital leave the market, but rather record outflows. Nevertheless, such an extreme imbalance sends a very different message than a routine pullback with indifferent participation.
For the week, total Capital Weighted Volume was above average, with approximately 61% directed to the downside. Capital Weighted Dollar Volume was elevated as well, with the attached weekly totals indicating approximately 63% downside activity. The selling was not simply visible in price. It was supported by the activity beneath it.
Friday provided a limited counterattack. The generals and troops recovered some ground, but the equal-weight lieutenants and dividend brass weakened further. The bounce therefore did not produce a unified recovery, and all four formations finished the week lower.
An extreme downside session can precede a meaningful recovery if selling becomes exhausted. It can also mark an acceleration of distribution. The distinction must be established by what follows. A rebound with expanding upside participation would offer different evidence from a light volume rally that stalls beneath broken support.
The bears delivered a powerful argument. The bulls still have the right to rebut it, but they now need more than reassuring testimony.
The S&P 500: A Breached Gate, Not Yet a Fallen Kingdom
The S&P 500 declined -2.68% to 7,376.86, closing beneath the important 7,500 position identified in last week’s marching orders. That former support now becomes an initial recovery checkpoint. Until it is reclaimed and maintained, an advance toward 7,500 could represent a retest of lost ground rather than restoration of the offensive.
The next defensive neighborhood is near 7,300, reinforced by the rising 200-day moving average near 7,324. Below that area, our next reference is 7,230, followed by the more substantial, double fortified support zone near 7,100. These levels are areas to evaluate buyer response, not promises that buyers will prevail.
Above the market, recovering 7,500 would be the first repair. The 50-day moving average, now near 7,650, represents additional ground to reclaim. The index remains above its 200-day average, but the margin between price and that longer-term defense has narrowed considerably. Overall, Thursday’s massive bar is the new short-term trading range. 7350 must hold for the bulls’ hopes to survive the bearish assault. Midpoints of 7500 and 7525, represent intermediate targets to regain footing. Closing above 7700 re-levels and neutralizes the field.
The capital-weighted volume evidence is more cautionary. Both accumulated S&P 500 Capital Weighted Volume and capital flow still hold above trend. But after peaking in early October, the market’s supply lines have weakened ahead of the corresponding price. With the barrage of downside acceleration occurring over the last few weeks, the trend lines are now within striking distance of the bears.
The Generals: From Commanding Heights to Recovery Orders
The generals, represented by the Invesco QQQ Trust, Series 1, suffered the heaviest damage, declining -4.98%. Their loss of 685, followed by the nearby rising trend position, changed the immediate assignment from defending an uptrend to repairing a breakdown. Buyers eventually appeared near 650, allowing a partial recovery from Thursday’s low, but not a recovery of the breached defenses.
The former 685 support area is now an important resistance checkpoint. A sustained recovery above it would be a necessary first step toward reestablishing a more constructive trend. It would not, by itself, erase the damage or guarantee that the offensive had resumed.
Below the market, 650 is the immediate position to defend. A sustained failure there would shift attention toward the next major support area near 600. That is a contingency on the map, not a predetermined destination.
The weekly chart also shows why price and volume indicators should be read together rather than selectively. Trading activity expanded as the generals fell, while the Money Flow Index weakened while price lost support. The generals can still regroup. For now, however, a counterattack beneath lost support is not the same as repossession.
The Lieutenants and Brass: Relative Shelter Meets Absolute Risk
The equal weight lieutenants, represented by the Invesco S&P 500 Equal Weight ETF, began the week pressing toward their former record area. They established a higher weekly high, but could not retain the advance, finishing down -1.04%. Their weekly candle records the rejection of higher prices, even though this formation suffered less damage than either the generals or the capital weighted S&P 500.
That relative strength remains meaningful. It is not, however, a substitute for an advancing price trend. The lieutenants need to hold their recovering structure and make another credible attempt at the former highs near 225. The previously identified 205 support area remains a deeper defensive reference.
The dividend brass commanders, represented by the Schwab U.S. Dividend Equity ETF, also attempted to extend their advance before retreating -1.70%. They posted a higher high and a lower low than the previous week, creating an outside week with a comparatively compact body and shadows on both sides. The candle has spinning top characteristics, but the more important message is the failure to hold new ground after a strong October advance.
An outside week shows that both sides pushed beyond the prior battlefield boundaries. A lower finish tells us which side held the advantage when the firing stopped. It does not independently confirm a lasting reversal.
The brass remain better positioned than the generals relative to their recent price structure, with the earlier $33 and $32 areas serving as deeper support references. But the old guard’s assignment has changed. After several weeks of carrying the colors, it must now demonstrate that its recent gains can withstand a broader withdrawal of capital.
The Old Era city did not collapse this week. Its claim to being untouched by the neighboring conflict did.
The Troops: Back at the Trenches
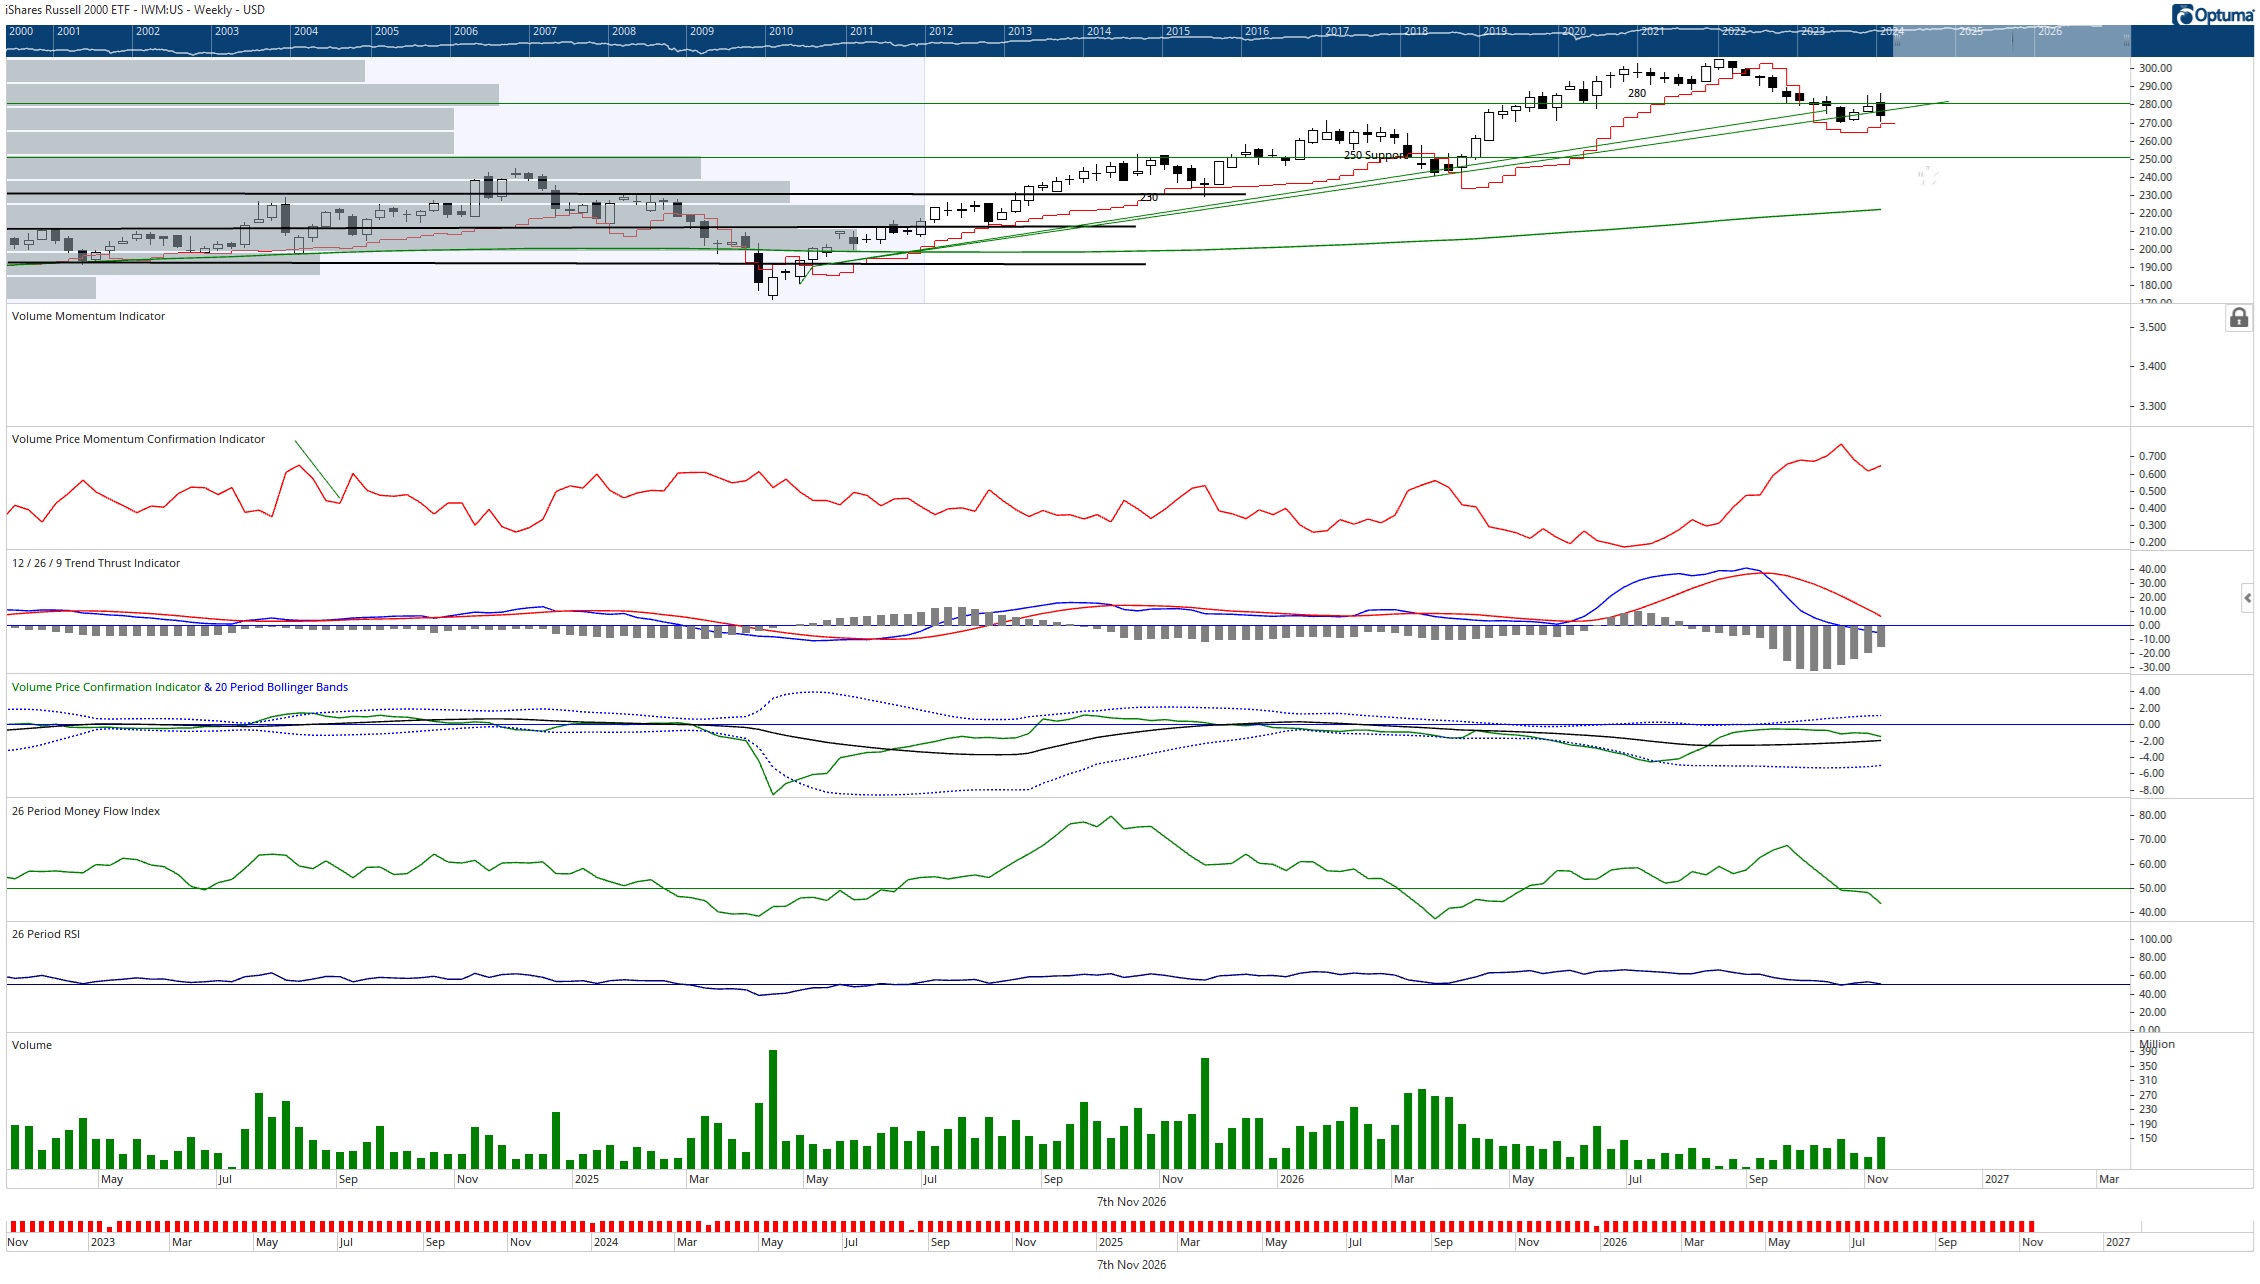
The small cap troops, represented by the iShares Russell 2000 ETF, declined -2.03%. Their early advance pushed beyond the previous week’s range, but Thursday’s reversal sent them back toward intermediate trend support. Friday’s recovery left the battle around that rising support line unresolved, with 280 still an important position to recapture.
For the broadening campaign, the distinction between touching support and establishing support is especially important. The troops have repeatedly approached the 280 barricade without securing it. A sustained recovery above that area, followed by progress through 285, would offer more persuasive evidence that the infantry is rebuilding its formation.
The weekly Money Flow Index has also slipped below its midpoint, reinforcing the need for confirmation rather than confidence based solely on a trend line. The troops are standing near their trenches, but standing near a trench is not the same as holding the field. The most important directive is holding 270; doing so keeps the troops alive and in the game.
Two Cities, One Liquidity Test
The New Era versus Old Era distinction remains useful. It helps explain why a technology-centered portfolio and a dividend or equal-weight portfolio can experience very different markets. It does not establish a permanent protective relationship between them.
Many Old Era sectors are declining less, or even advancing, during New Era weakness. We are discerning the possibility that the general’s liquidation may continue without producing a broad market bear phase. That remains a valuable question, not an unconditional assurance. This week illustrated both sides: the broader formations held up better than the generals, but they did not escape the retreat.
Our Second Half Outlook made a related distinction between healthy broadening and distribution overwhelming rotation. The constructive path required the broader market to gain sponsorship while technology digested its advance. The adverse path involved persistent selling, weakening participation, and an inability of the largest companies to continue carrying the index. Thursday moved the evidence closer to that adverse possibility, although one difficult week does not establish its completion.
That is the continuing purpose of our And Then There Were None framework. It is not a declaration that every regiment must fall whenever a general retreats. It is a warning about dependence on concentrated leadership as sponsorship weakens. And Then There Were Some remains the constructive alternative: capable replacement leaders attracting sufficient capital to sustain the broader advance.
This week, resilience still varied. There were no positive weekly finishes among our four principal formations.
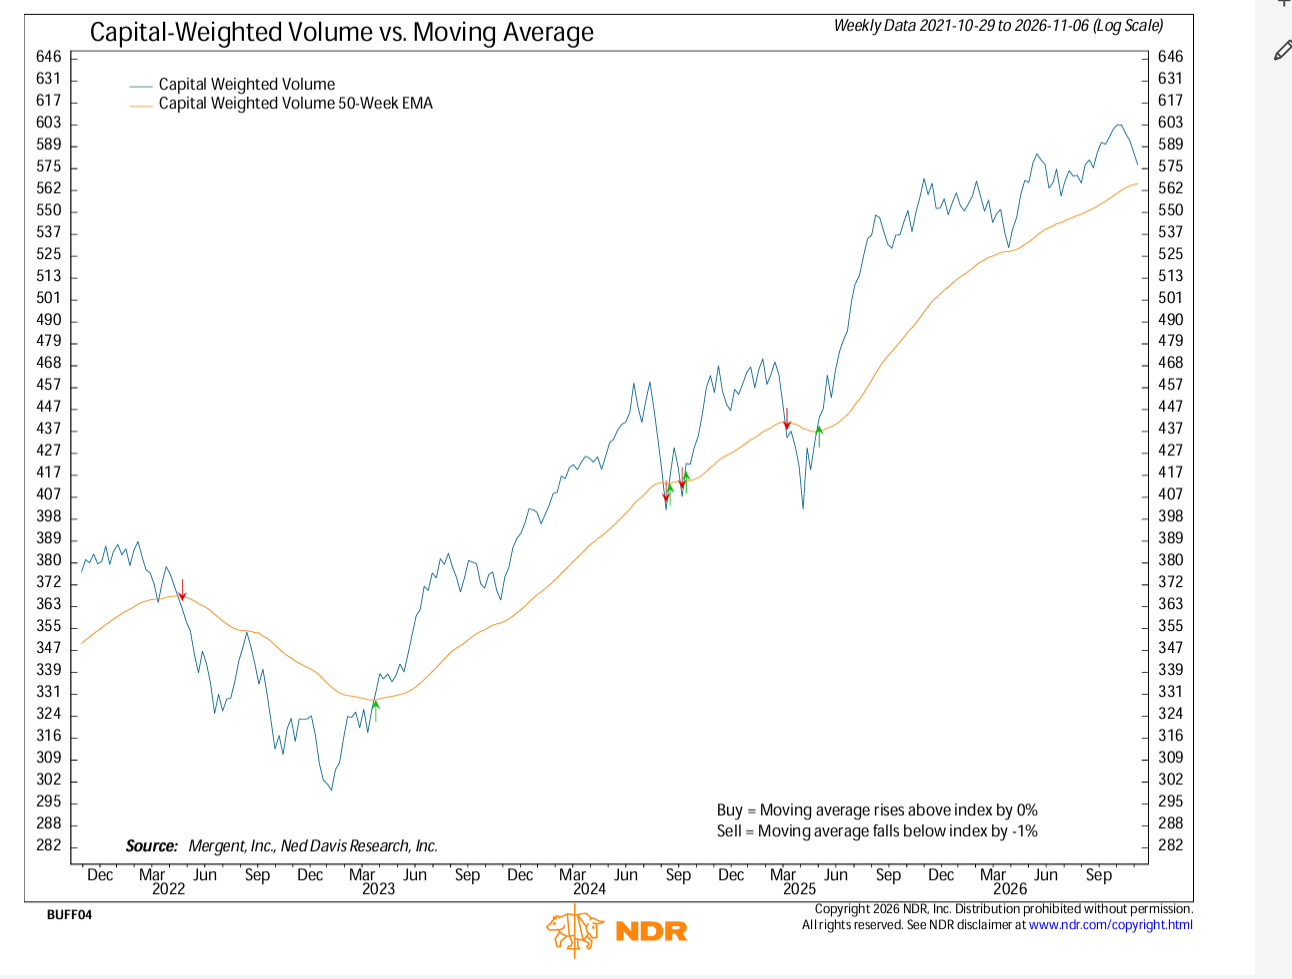
The longer-term evidence has not completely surrendered. The weekly Capital Weighted Volume measure remains above its rising 50-week exponential moving average, although its sharp retreat from recent highs has narrowed that cushion. That longer weekly measure and the daily S&P 500 measure are not interchangeable. One remains above trend; the other has already slipped below its reference.
The golden thread connecting the two markets is capital sponsorship. Rotation can redistribute that thread. Persistent distribution can fray it. Price is the market’s testimony. Volume is the polygraph. This week, the cross-examination became considerably less comfortable for the bulls.
Commodities: Different Gates, Different Responses
Oil met the resistance near $120 discussed in the previous report and retreated toward the lower end of its new range near $95. The energy scouts reached the upper gate but could not secure passage. That reversal lessens the odds of an upside-breakout and questions whether buyers can defend the lower boundary.
Gold offered a contrasting response. After probing beneath the previously-watched $3,900 area, it found support nearer $3,800 and rallied through the prior week’s range. The bulls found buyers, although slightly farther back than their original defensive position.
For gold, the task is now to preserve that response and establish follow through. A sharp recovery from support is constructive evidence, but its durability will be measured by whether subsequent pullbacks attract demand rather than reopen the breach.
Silver moved in the same direction, but less forcefully, remaining within the previous week’s range. Its weaker response is consistent with a market balancing precious metal demand against industrial sensitivity. Silver’s industrial uses include electronics and applications connected with AI infrastructure. Its weakness, in contrast to gold, also speaks to the new era of AI trade. Thus, even among the metals, our two cities retain their influence. Gold found a clearer defensive bid. Silver’s counterattack still needs confirmation.
Risk Command: Protect the Capital, Not the Plot
October’s change of command deserved recognition. November’s first week demands a fresh assessment. The useful lesson from “Doji Know?” was not that a candle could reveal an inevitable ending. It was that market behavior at support and resistance could identify where the next change might begin.
The same discipline applies when those positions fail. The immediate marching orders now begin with repair. The S&P 500 needs to defend the 7,300 neighborhood and work back above 7,500. The generals need to preserve the response near 650 and reclaim 685. The troops need to hold their intermediate trend support and attempt to secure 280. The lieutenants and brass need to demonstrate that their reversals are interruptions within recovering structures rather than the start of another sustained retreat.
Most importantly, those price repairs need stronger upside volume and improving capital sponsorship. A healthier market requires more than different regiments taking turns losing less. The constructive resolution would see selling pressure recede, support hold, and the broader formations resume their advance while the generals stabilize. The adverse resolution would see rebounds fail beneath broken support as heavy distribution spreads further across the field. Our responsibility is to distinguish those developments as they occur, not to preserve a favored storyline.
Position sizing, concentration awareness, liquidity needs, and predetermined risk thresholds remain the practical tools of command. Diversification can reduce dependence on a single city, but it cannot guarantee protection when both cities come under pressure.
With a nod to Dickens, it is a far, far better thing to protect capital than to protect a prediction. We need not forecast the final chapter to recognize when the barricades require reinforcement.
Risk management always gets the final word.
Grace and peace,
BUFF DORMEIER, CMT






Updated: 11/9/2026. Historical references do not assume that any prior market behavior will be duplicated. Past performance does not indicate future results. This material has been prepared by Kingsview Wealth Management, LLC. It is not, and should not, be regarded as investment advice or as a recommendation regarding any particular security or course of action. Opinions expressed herein are current opinions as of the date appearing in this material only. All investments entail risks. There is no guarantee that investment strategies will achieve the desired results under all market conditions and each investor should evaluate their ability to invest for the long term. Investment advisory services offered through Kingsview Wealth Management, LLC (“KWM”), an SEC Registered Investment Adviser.