Volume Analysis | Flash Market Update 12.19.22
In our 12/5 edition of volume analysis, we wrote, “The volume and other internal data may be suggesting this is a short-term rally with still more downside to go. Traders seem to be speculating that inflation is on the down swing and the Fed will soon move to be accommodative”…..”The S&P 500 is threatening to break it’s 200 day moving average while volume and capital flows are not even close to challenging corresponding levels. This action illustrates that the big money is not participating in the buying spree. Thus, the recent rally echoes the former summer rally in this and most other ways. Additionally, our other leading indicators are still lagging long term. This suggests the smart money is not buying the narrative that the Fed / inflation is done but rather they may believe the Fed has more to go.”
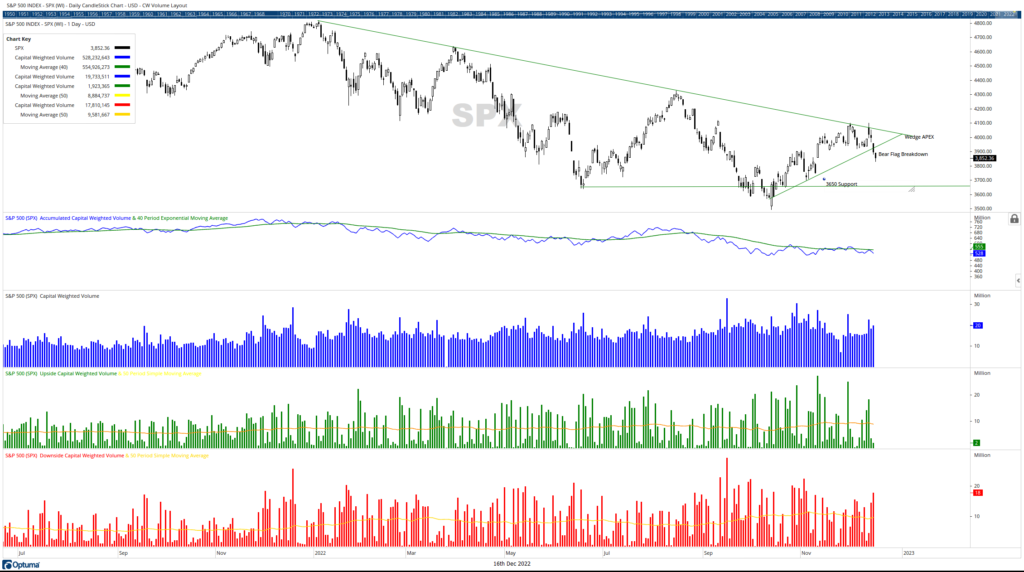
This past week the Federal Reserve spoke and broke all hopes of accommodation by stating “Today, the FOMC raised our policy interest rate by 1/2 percentage point. We continue to anticipate that ongoing increases will be appropriate in order to attain a stance of monetary policy that is sufficiently restrictive to return inflation to 2 percent over time. In addition, we are continuing the process of significantly reducing the size of our balance sheet. Restoring price stability will likely require maintaining a restrictive policy stance for some time.” On the back of the Federal Reserve’s hawkish outlook, equity markets dropped from a weekly high of 4100 to close @ 3852, beneath our critical rising wedge / bear flag support of 3900.
In last week’s 12/12 VA Flash Update we continued the theme stating, “The S&P 500 is caught between a trading range with support at 3900 and resistance 4100. Next week’s long anticipated Federal Reserve meeting coincides with the coming conclusion of a rising wedge formation. These conditions are ideal for a potential breakout/breakdown of our forementioned training range. A rising wedge, aka a bear flag, occurs during a short-term bull counter trend within a longer/intermediate-term downtrend. The inflection point between these opposing trends is the apex. When price reaches the point of the apex, it naturally forms an end to a steadily tightening trading range (see attached chart SPX Ascending Wedge/ Bear Flag). Often the tipoff in identifying a bear flag is weakening volume. In our weekly analysis, we have consistently pointed out that the S&P 500’s Capital Weighted Volume is relatively weak given the strength of the uptrend.”
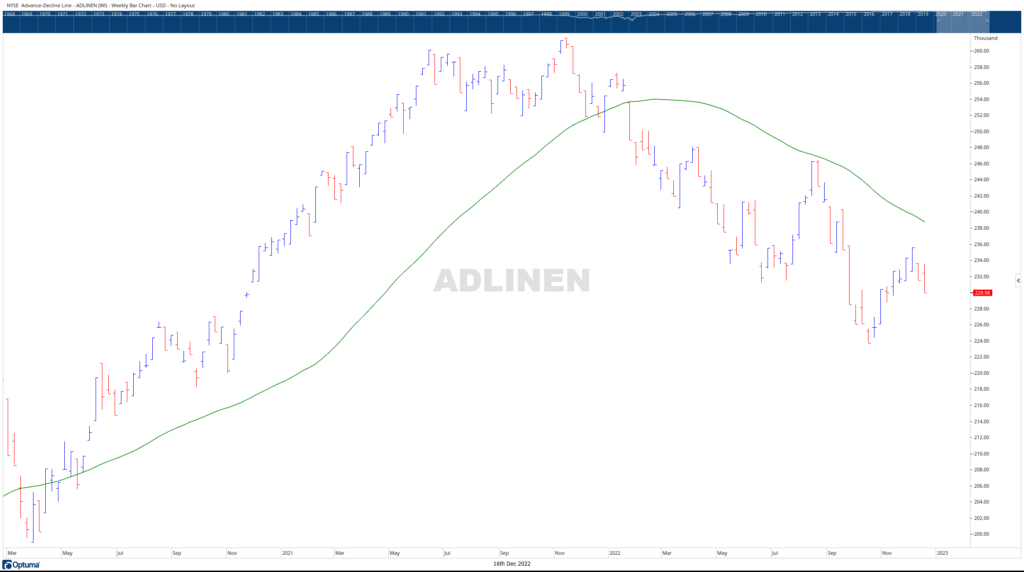
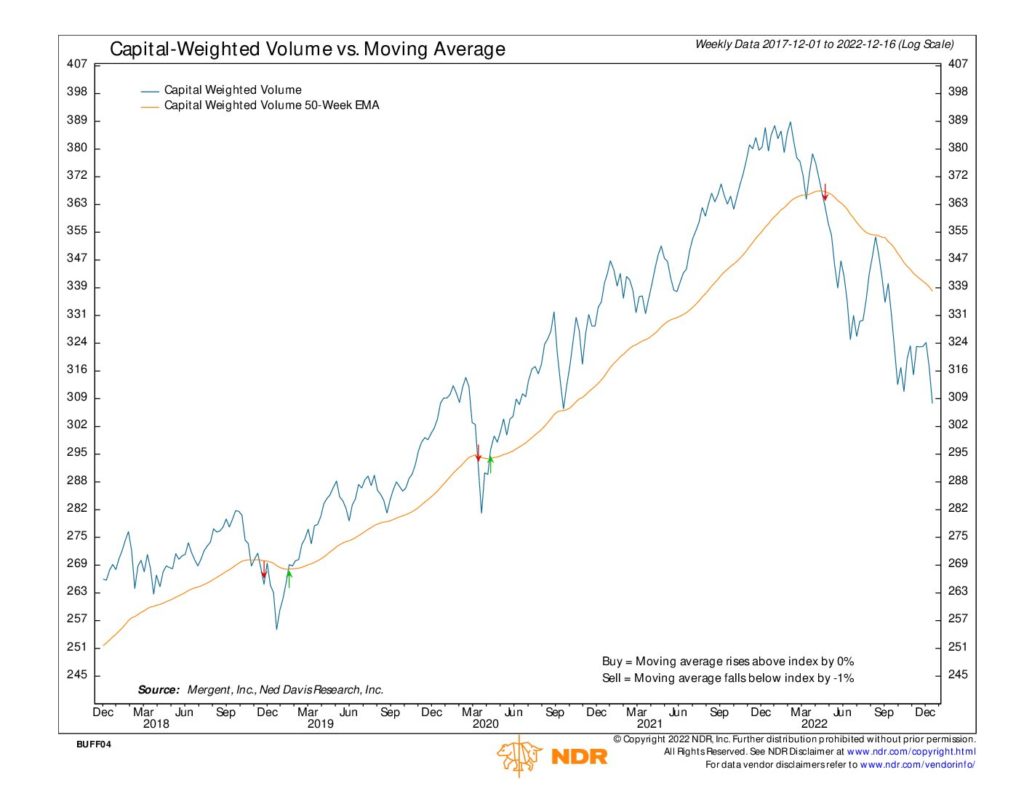
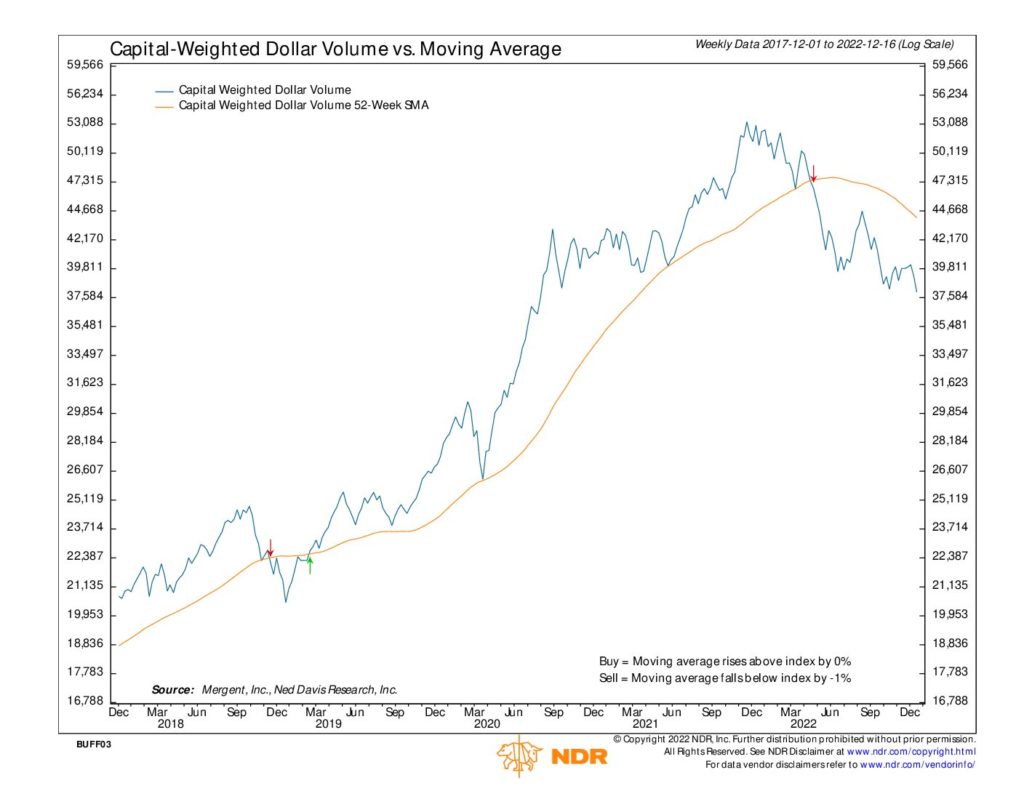
Capital flows were strong for the week. Outflows tallied the week @ $67 Billion, compared to only $39.6 Billion capital inflows. Moreover, Capital Weighted Volume and Dollar Volume both broke 2-year lows with Capital Weighted Volume easily slicing through former support @ 310 and Capital Weighted Dollar Volume barely breaking 38,000 support. These areas will need be retaken by the bulls if they have any hope to stage a Santa Claus or year-end counter rally. Additionally, our internal indicators, the Advance-Decline and New 52-week highs, also closed sharply lower on the week (more on this in next week’s edition).
Now that the bear flag’s wedge has officially broken down, the new trading range is now 3900 (wedge resistance) to 4000 (Apex) on the upside with downside support @ 3650.
Grace and peace to you my friends,
Buff Dormeier