Volume Analysis ‘Flash Market Update’ — 10.3.23

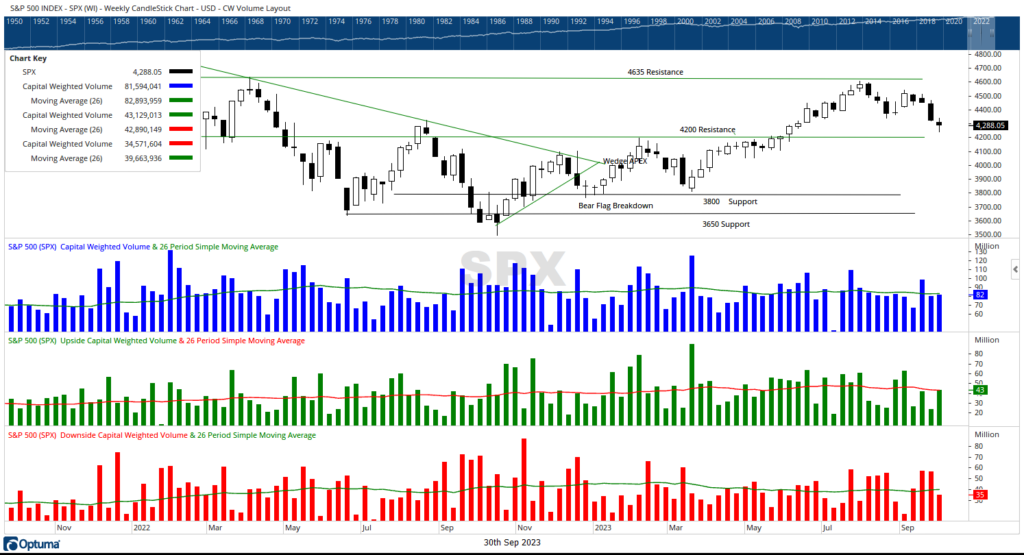
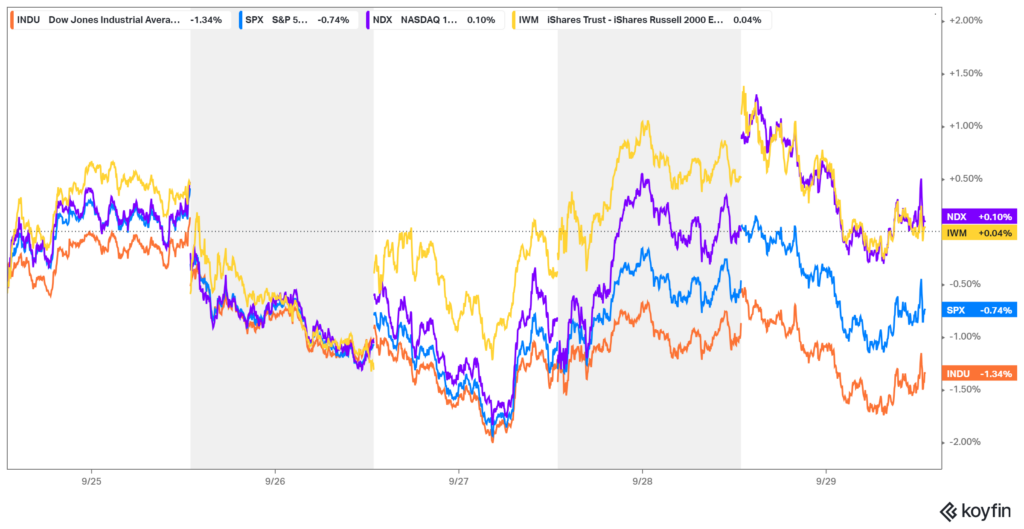
While the S&P 500 saw a weekly decline of -0.74%, the Russell 2000 ETF IWM, representing the troops, remained relatively unchanged at +0.04%, while the generals (NDX) managed a slight increase of 0.10%. In contrast to the S&P 500’s downward trajectory for the week, Capital-Weighted Dollar Volume showed a different story. Capital inflows surpassed outflows, with $43 billion flowing in compared to $34.5 billion flowing out of the S&P 500 components. However, it’s worth noting that the Advance-Decline Line continued to lose ground, signaling a bearish trend.
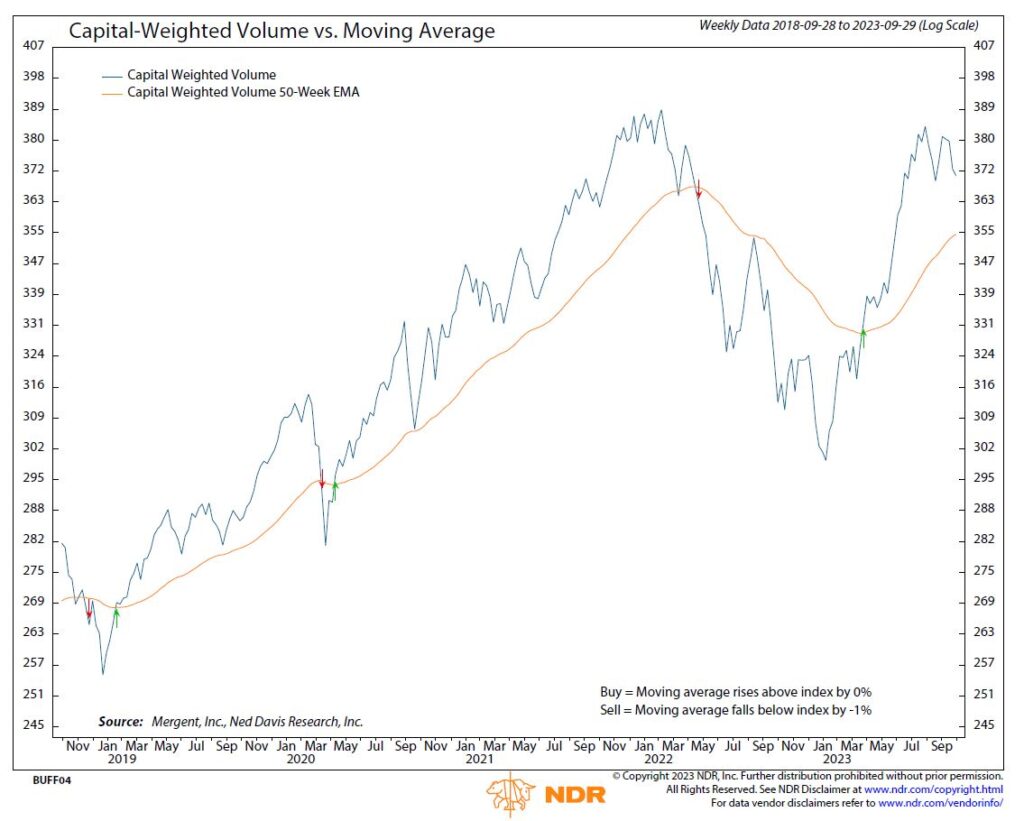
In our September 18th Volume Analysis Flash Update, I mentioned that as we entered October, investors were pondering what lay ahead. Specifically, I stated, “Now, as we look ahead to October, investors are contemplating what lies on the horizon. October has a reputation as the month of market crashes, but my experience suggests that these corrections are more likely to occur following stronger preceding months rather than weaker ones. Despite the troops (Russell 2000) experiencing a significant decline of over 8% over the past couple of months, Capital-Weighted Volume and Capital-Weighted Dollar Volume have only shown marginal retreats. Thus, the aforementioned phase of light-volume consolidation may have transformed into a healthy bullish condition as we enter the fourth quarter.”
Now, let’s revisit those comments with some analysis to back them up. Historically, we have seen that when the S&P 500 has risen double digits in the first seven months of the year, followed by a down August and September, the fourth quarter tends to deliver positive returns. In addition to these trends, market sentiment is now leaning towards overly pessimistic territory. This is evident from the AAII Sentiment Survey of individual investors, which has recently crossed the 40% bearish mark, currently standing at 40.9%. The 2-month rate of change in bearish AAII sentiment has nearly doubled (1.9 times) over the past two months (source: https://www.aaii.com/sentimentsurvey). The last time this indicator was oversold to this extent was in January 2022, which turned out to be an excellent entry point for the bulls.
In summary, the S&P 500 remains above its critical intermediate support level of 4200, and S&P 500 capital flows (Capital-Weighted Dollar Volume) are still holding above support, showing a bullish divergence from price. Seasonality trends are beginning to turn positive this month, while sentiment readings from individual investors are at washout levels. Therefore, despite the anticipated weakness in August and September, the weight of evidence in the data we follow still points to a potentially healthy bullish setup for the fourth quarter.
Grace and peace my friends,
BUFF DORMEIER, CMT®


Updated: 10/3/2023
Historical references do not assume that any prior market behavior will be duplicated. Past performance does not indicate future results. This material has been prepared by Kingsview Wealth Management, LLC. It is not, and should not, be regarded as investment advice or as a recommendation regarding any particular security or course of action. Opinions expressed herein are current opinions as of the date appearing in this material only. All investments entail risks. There is no guarantee that investment strategies will achieve the desired results under all market conditions and each investor should evaluate their ability to invest for the long term. Investment advisory services offered through Kingsview Wealth Management, LLC (“KWM”), an SEC Registered Investment Adviser.


