Volume Analysis | Flash Market Update 9.19.22

WRITTEN BY: CHIEF TECHNICAL ANALYST, BUFF DORMEIER, CMTⓇ
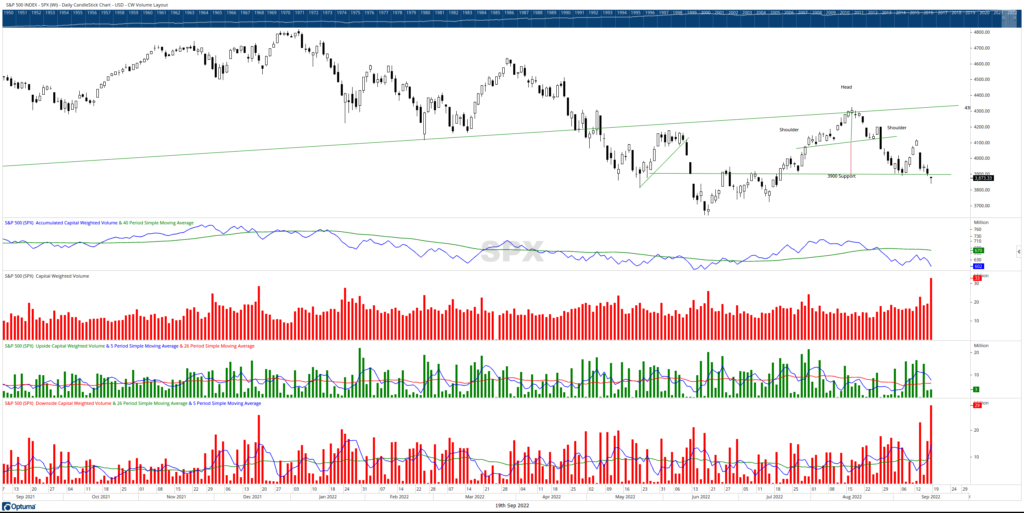
Last week staunch S&P 500 support @ 3900 was violated. 3900 was the minimum target objective of the former Head and Shoulder’s pattern (measured by the top of the head to the neckline).Additionally this support level was tested several times and held, making this break of support that much more significant. Rarely do these chart patterns playout in such textbook fashion.
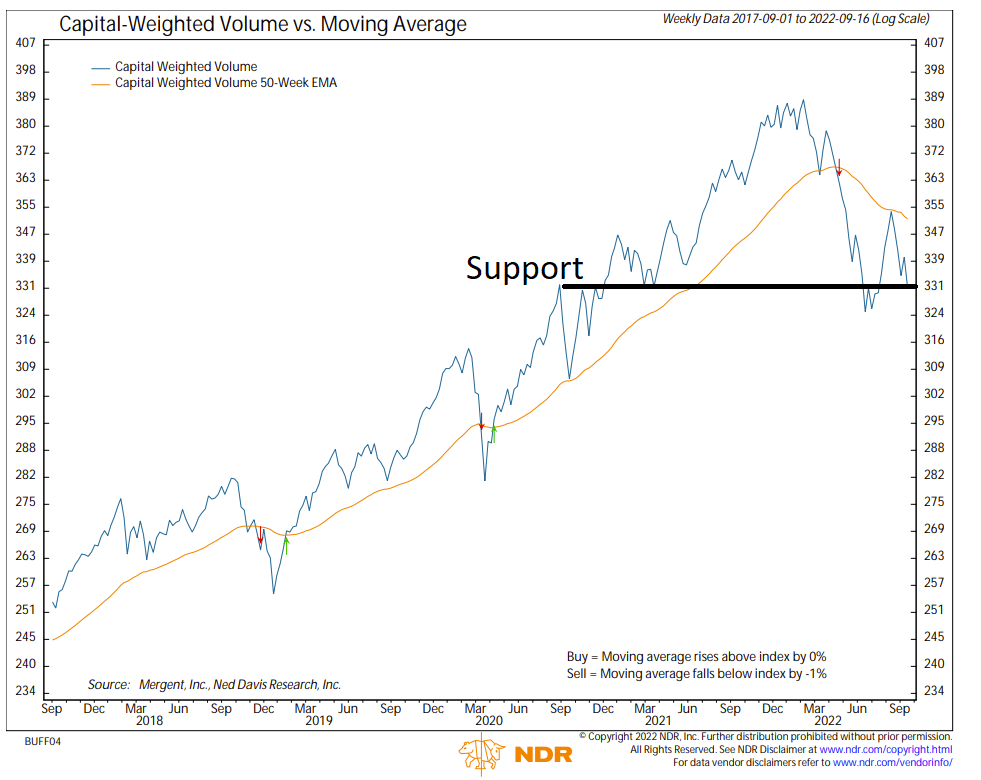
Although price support was broken, Capital Weighted Volume 331 support still thinly holds. A bullish outlook could be argued should this important volume support continue to hold above 331. However, with price breaking below 3900, the outlook from a price perspective remains bearish. All told, the market remains in a stalemate with price slightly below support and Capital Weighted Volume still holding slightly above. Next price support is 3820.
If price and volume support were to both violate these important levels, the next major support resides at the former S&P 500 3600 lows. The peak on the S&P 500 is 4800 while the trough is 3600. That places the midpoint between the peak and trough at 4200 (our former critical resistance level). A month ago, the S&P 500 breached 4300, breaking through the midpoint . Historically, during a bear market, the S&P 500 has never broken the prior lows (now 3600) after breaking through the midpoint (previously 4200). That of course does not mean it is impossible. Yet I am not one who generally bets on a first. Despite a couple of very nasty down moves (August 26th & Sept 13th), the Volatility Index (VIX) has only risen to 26. After such significant down days, one might expect volatility to be higher. This muted volatility suggests a big move may still be forthcoming. But directionally which way is not implied. We will watch these levels with great interests understanding it is in these types of environments where risk management can be friendly to the savvy investor.
Grace and peace, Buff Dormeier


