Volume Analysis ‘Flash Market Update’ – 7.24.23

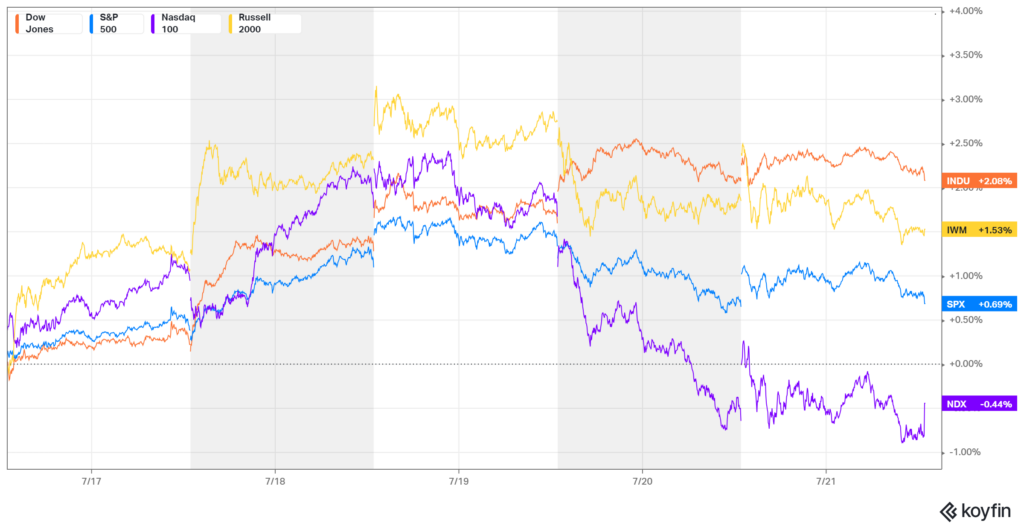
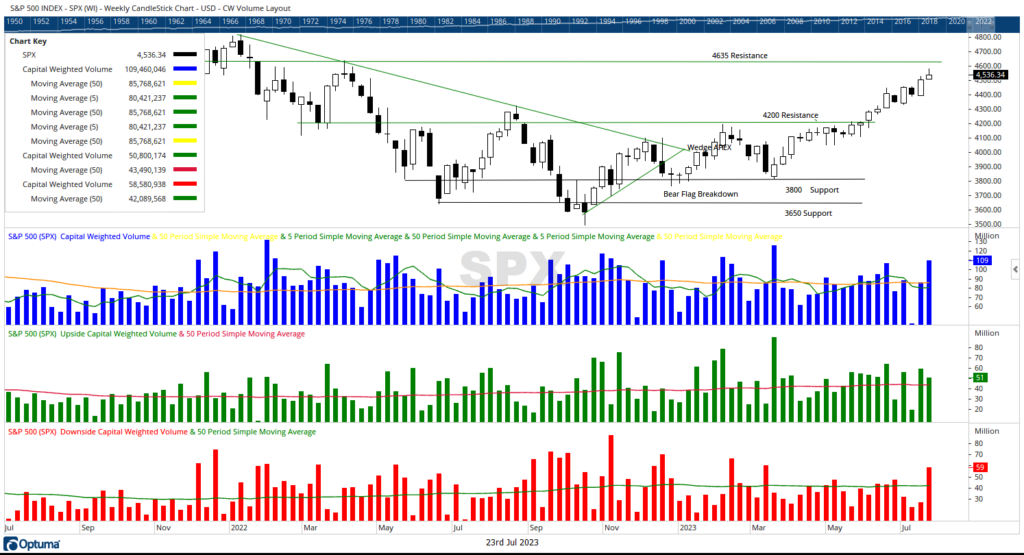
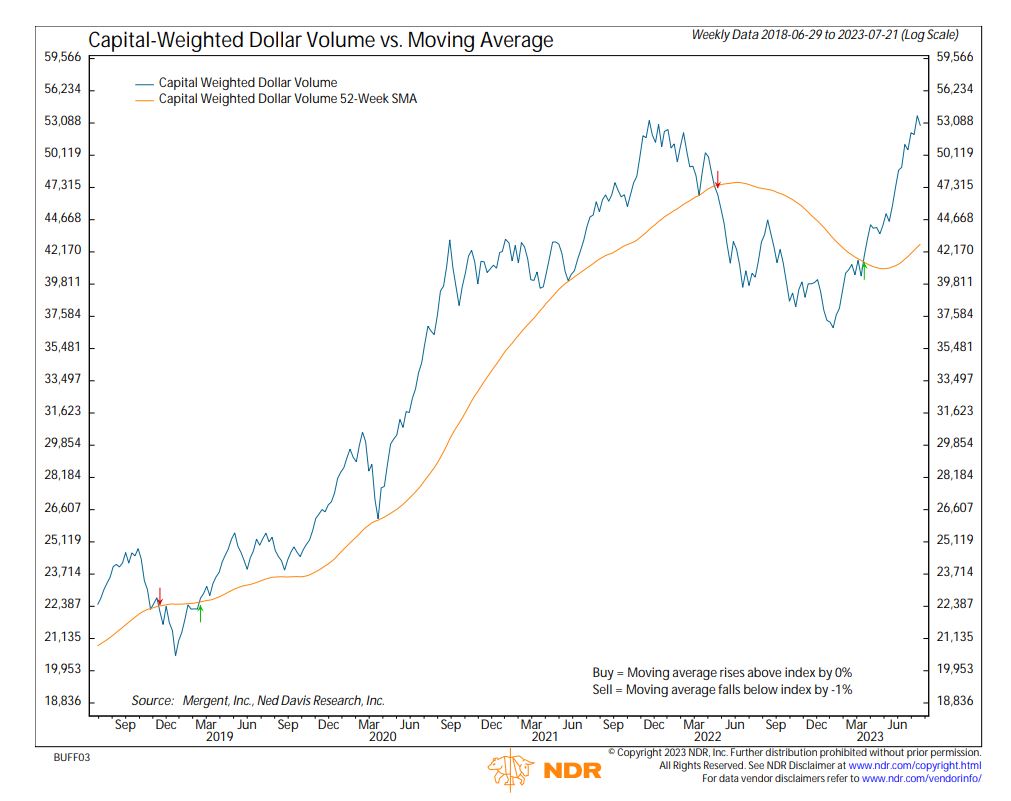
This past week the troops (Russell 3000) came to play while the generals (NDX 100) largely sat the week out. For the week, the Russell 3000 was up approximately 1.5%, the S&P up 0.69%, and the Nasdaq 100 was down 0.44%. Trading was marked by high volume. S&P 500 Capital-Weighted Dollar Volume was significantly above average. $50.8 Billion came in and $58.5 Billion flowed out of the S&P 500, both above their averages.
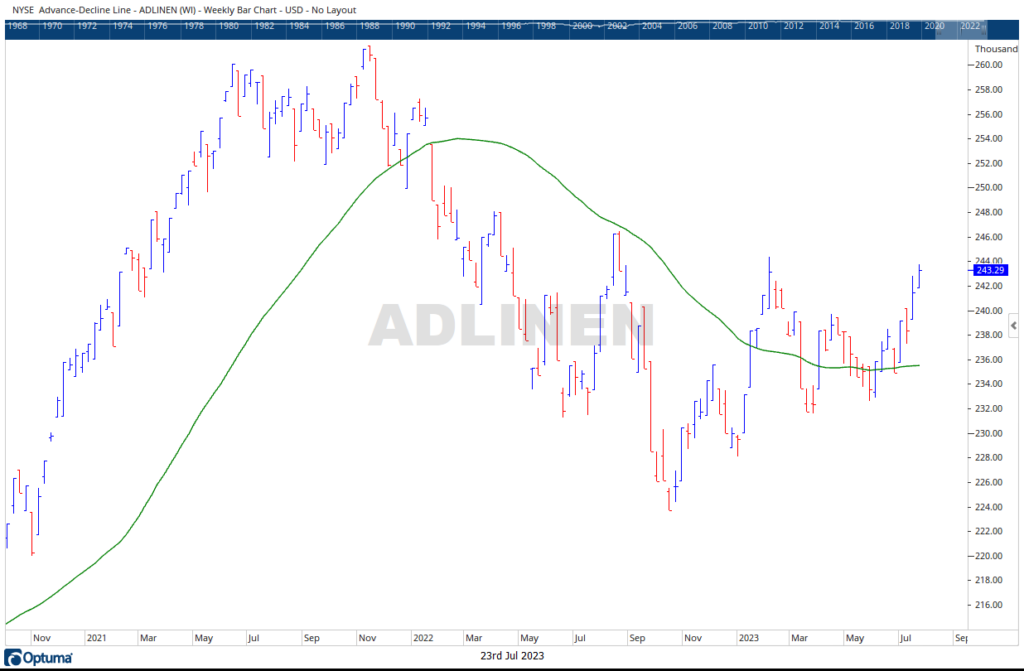
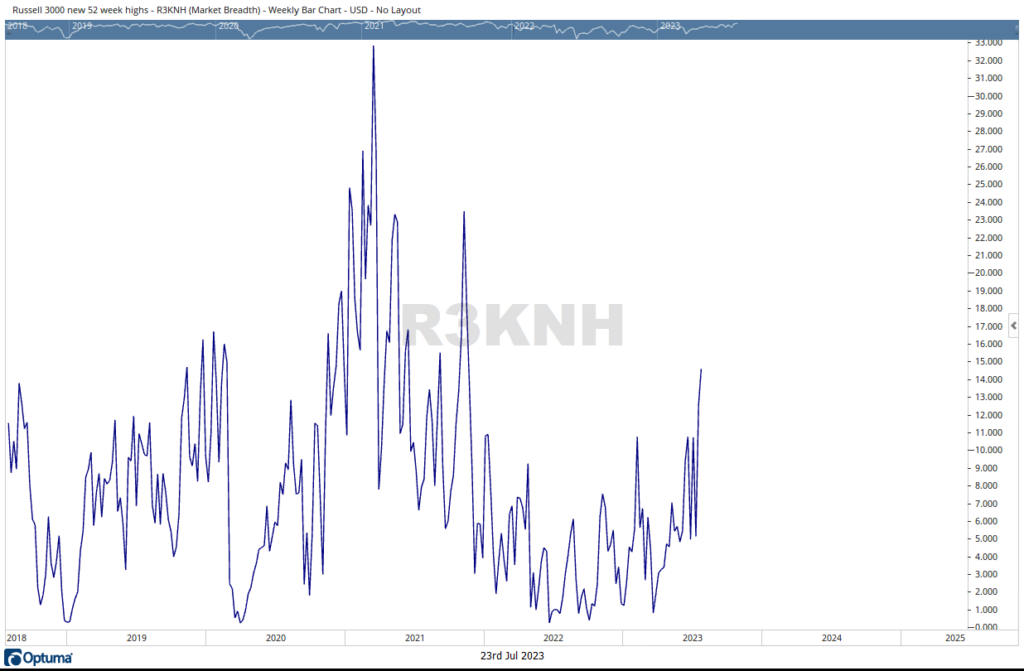
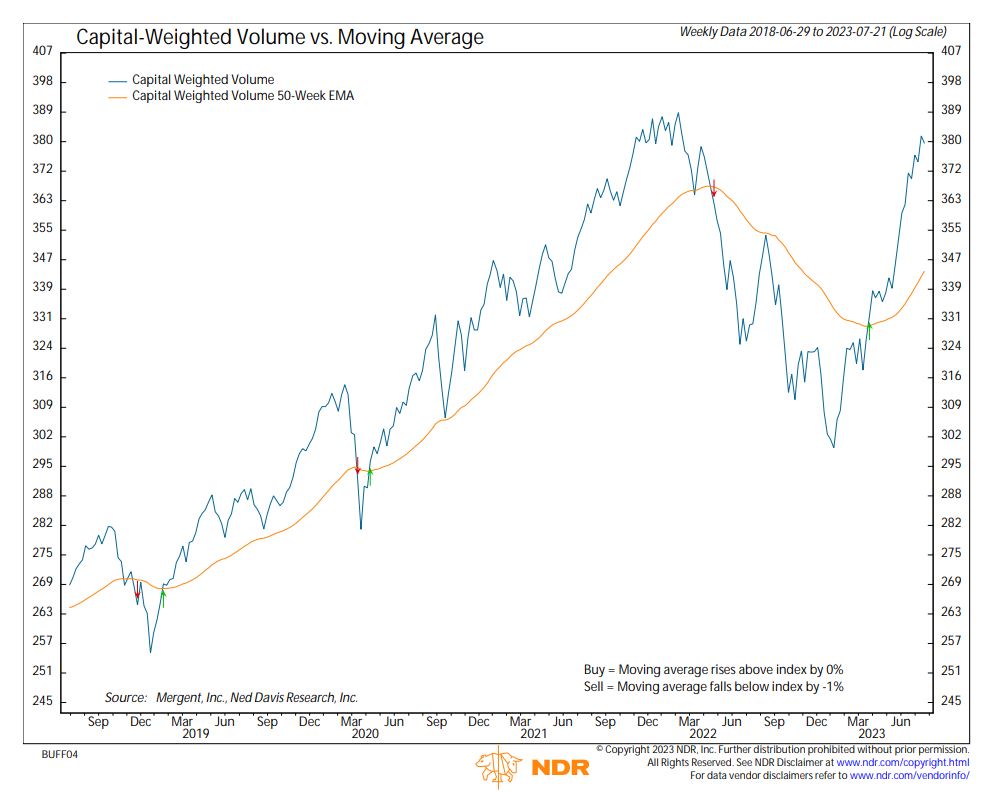
Although the S&P 500 ended the week higher, both the accumulative trends of Capital-Weighted Volume and Capital-Weighted Dollar Volume fell slightly. As a result, both liquidity (volume) and capital flows were negative on the week. Both Capital-Weighted Volume and Capital-Weighted Dollar Volume are meeting one of the strongest forms of resistance in existence – all-time highs. Typically, it is considered healthy for markets to pause and consolidate before breaking out to new levels. Interestingly, last week’s action demonstrated one of the most bullish scenarios where the leadership (NDX 100) paused, but the lagging troops made significant progress. Moreover, there is additional evidence of the troops gaining strength, as seen from the Advance-Decline Line continuing to rise and the New Highs showing robust acceleration off new yearly highs. If these factors persist, they could point to an encouraging market situation with the potential for further advancements.
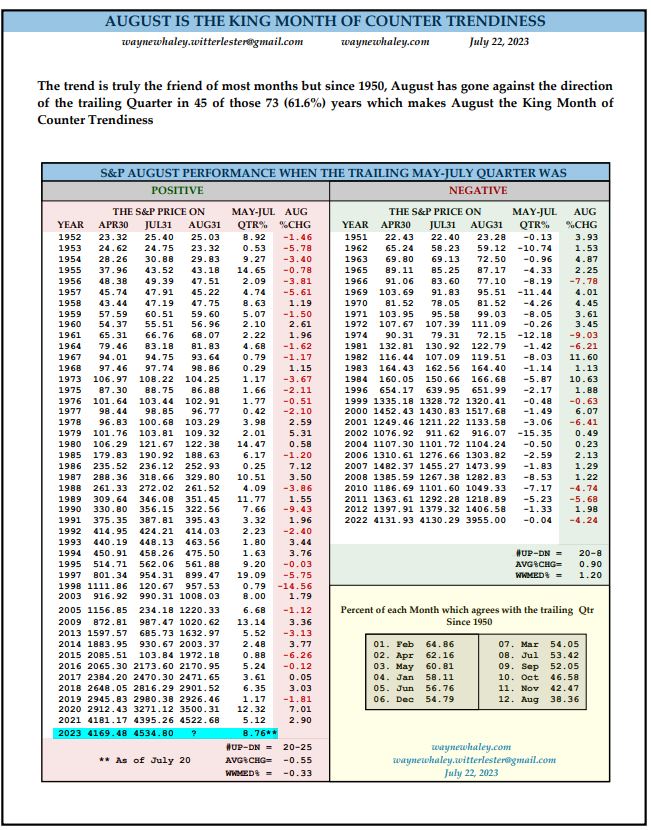
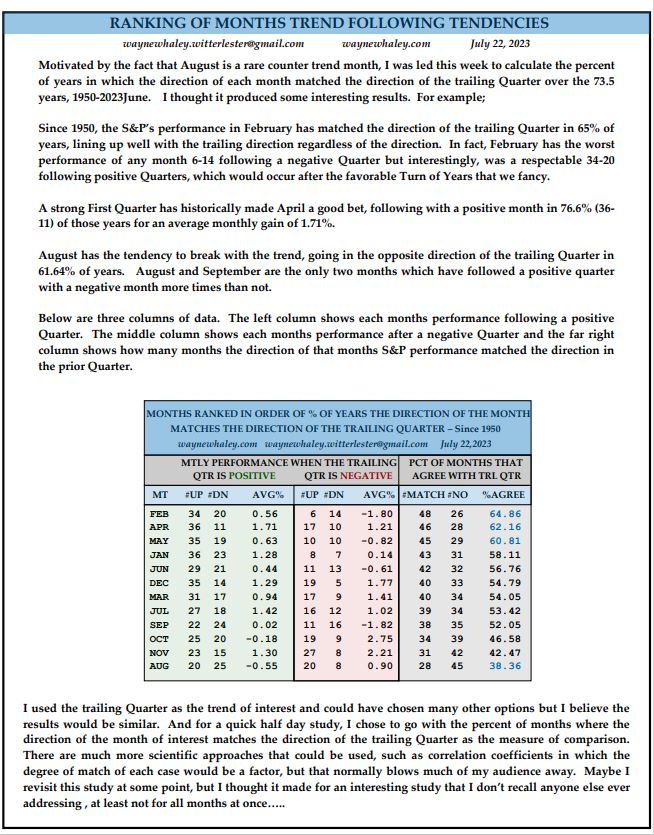
In last week’s flash update, I mentioned that our intermediate-term indicators were showing positive signs “green lights”, but I also wanted to caution about the possibility of countertrends developing during this time due to seasonality. These thoughts were based upon my experience in the investment field over the past 30 years, where I’ve observed patterns and made connections (patternicity or apophenia). Now, I’d like to reinforce that point with solid research from Wayne Whaley of WayneWhaley.com. According to Whaley’s analysis, going back to 1950, August has demonstrated a tendency to go against the direction of the trailing quarter in 45 of 73 occurrences (61.6% percent of the time). This makes August the “King Month of Counter Trendiness”. It’s important to note that most months continue with their prior trend, but among the three months that historically deviate from the existing trend direction, August had the highest probability of reversing.
Overall, S&P 500 Capital-Weighted Volume and Capital-Weighted Dollar Volume are bullishly leading prices higher, yet both are encountering strong resistance of all-time highs. Meanwhile, the formerly struggling troops and internals are now beginning to show bullish signs of recovery.
Grace and peace my friends,
BUFF DORMEIER, CMT®
Updated: 7/24/2023
Historical references do not assume that any prior market behavior will be duplicated. Past performance does not indicate future results. This material has been prepared by Kingsview Wealth Management, LLC. It is not, and should not, be regarded as investment advice or as a recommendation regarding any particular security or course of action. Opinions expressed herein are current opinions as of the date appearing in this material only. All investments entail risks. There is no guarantee that investment strategies will achieve the desired results under all market conditions and each investor should evaluate their ability to invest for the long term. Investment advisory services offered through Kingsview Wealth Management, LLC (“KWM”), an SEC Registered Investment Adviser.


