Volume Analysis | Flash Market Update – 7.1.24
And Then There Were None Part II
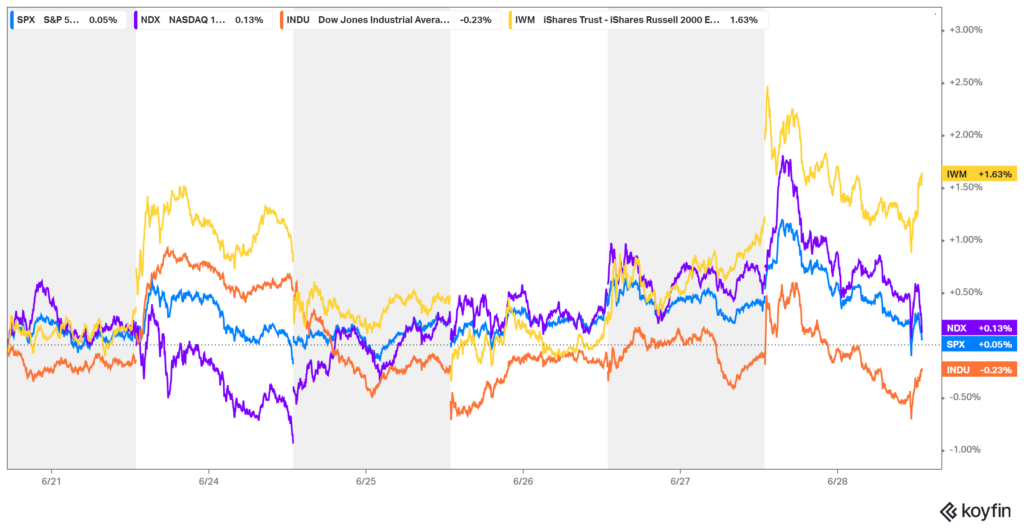
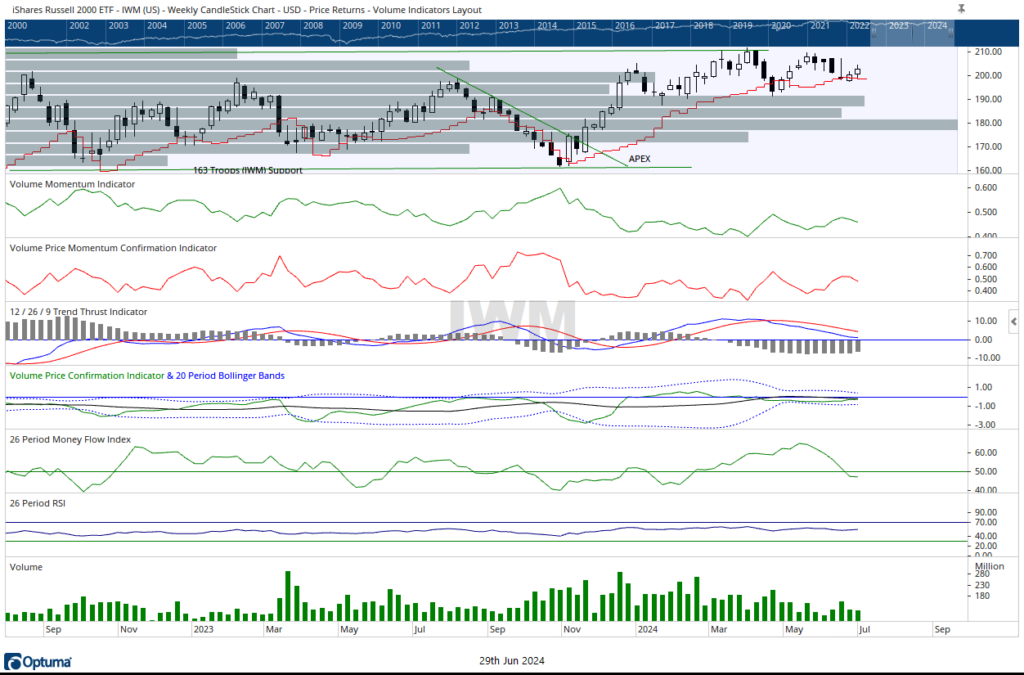
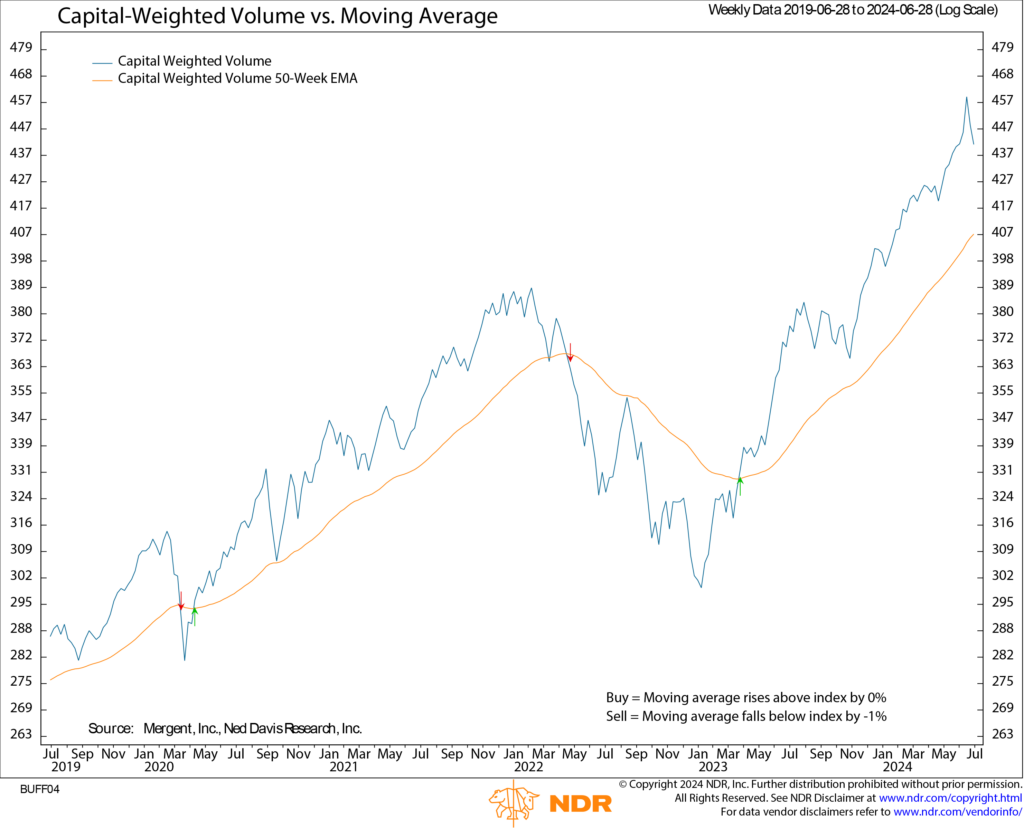
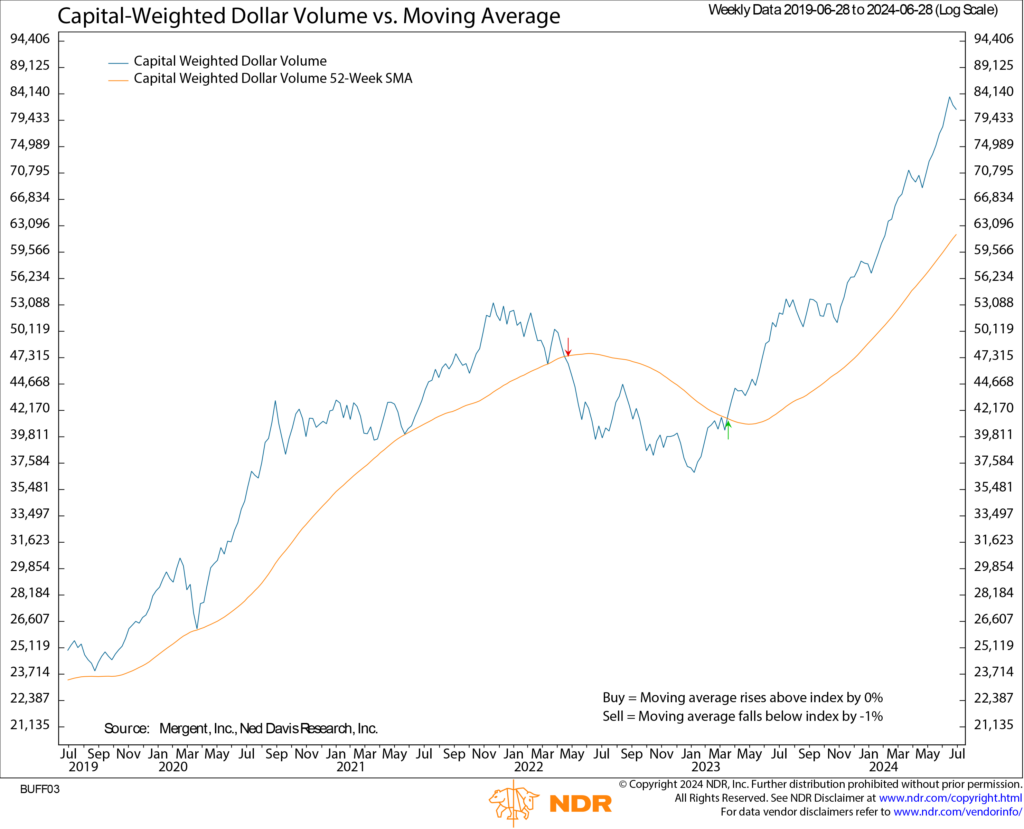
Under the surface, last week the broad markets appeared dull and lifeless. Nevertheless, internally strong forces were once again lively at work. The S&P 500 closed the week essentially unchanged, up 0.05%. The generals (NDX 100) also eked out a slight gain of 0.13%, but the lagging troops (iShares Russell 2000 ETF, IWM) led the market higher for the second week in a row, up 1.63%. Although prices experienced little action last week, capital-weighted volume was again exuberant for the second consecutive week.
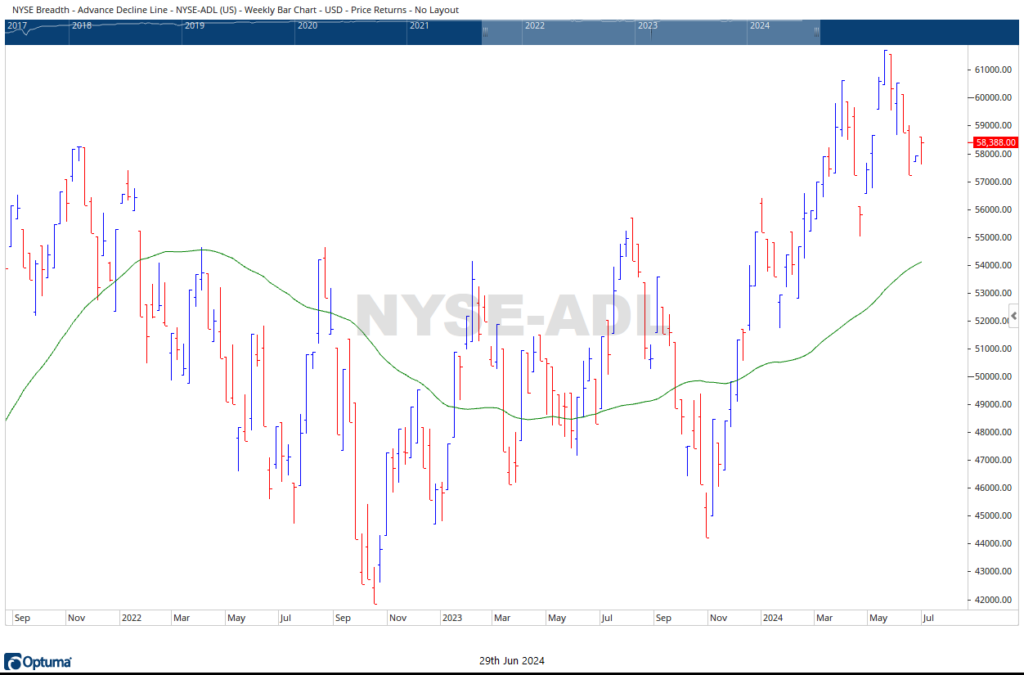
Monday started the week out with exceptionally strong capital flows, the highest volume of the week, led by the bears on a nearly 80% downside day. Then, both Tuesday and Wednesday, the bulls regained control, both scoring 90%+ upside capital-weighted volume days. To end the week and the quarter, the S&P 500 closed on exceptionally high capital-weighted volume again to the downside, with 88% to the downside. Market breadth, as measured by the NYSE Advance-Decline Line, was up slightly for the week but closed at the week’s low.
Two weeks ago, we witnessed the highest capital-weighted volume in the S&P 500 since the pandemic bottom. Although the S&P was up for the week, 70% of the volume was to the downside. This past week, capital flows were once again extraordinarily high, just slightly below the previous week’s massive surge. A similar phenomenon occurred three weeks before the flash crash: massive downside volume on muted price changes. So what does this high downside volume and muted price change infer? Imagine you are a very large institution that desires to quickly de-risk or rotate allocations. It would be difficult to scale down your mid and small caps without forcing down the prices from your operations. So instead, you might consider selling your most liquid stocks, the mega caps. These just happen to be your best performers, as the cap-heavy S&P 500 is beating the equal-weight S&P 500 14.48% to 4.96% year-to-date. The biggest contributor to the S&P 500’s outperformance is Nvidia, currently the third-largest component, up 149.50% year-to-date. With this in mind, let’s zero in on Nvidia as a case study.
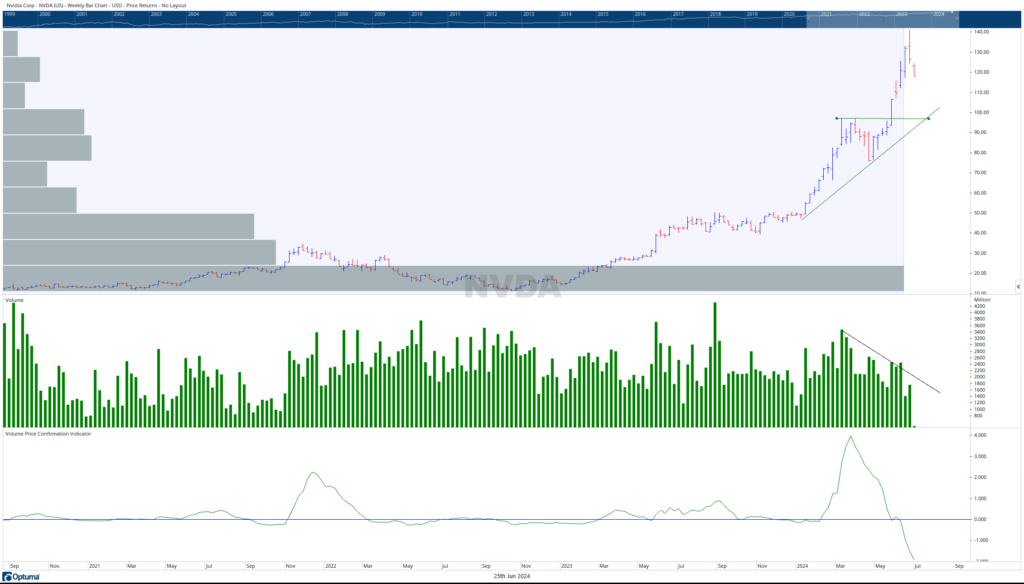
Observing NVDA’s weekly chart, Nvidia’s run was built on a huge base between post-split $20 – $30 (200-300 pre-split). Notice the huge gray bar running through the bottom of NVDA’s chart. This is volume at price, indicating how many shares were exchanged between these price levels. The length of this bar is massive and overwhelming, providing the fuel to launch NVDA into orbit. On May 22nd, NVDA broke out of a consolidation pattern at $100. This breakout corresponds to the split announcement. Notice, though, that although the price moved up rapidly from $100 to $140, the volume kept falling. This is important because volume is the fuel of the market. As an analogy, pilots, to get their plane to fly higher, must aim the trajectory higher. But if the pilot fails to also provide fuel, the plane will stall. Capital is the fuel of the markets. Here, NVDA was flying higher but with less fuel. This apparent weak demand in NVDA is evident by the drop in the Volume Price Confirmation Indicator, which calculates the asymmetry between the strength of the price trend and its corresponding volume.
Falling volume corresponding with rising prices implies that institutional players may not have been heavily participating in this part of the run-up from 100 to 140. If there was institutional absence, NVDA’s price was presumably driven higher by fickle retail investors who tend to buy on greed and sell on fear. In this specific case, many retail investors may not as familiar with Nvidia’s operations as it is not a household name. But they are aware of the importance of AI, news of the 10:1 split, and NVDA’s rapid price appreciation, making NVDA temporarily the largest company in the world. The intrigue may have sucked them in. Meanwhile, institutions whose position sizes had become overly extended due to the run-up were plausible sellers.
So what’s next? NVDA still has a huge base. It has support between $116 and $110. If $110 breaks, there is very significant support at $100. This is evident by the large extended volume at the $100 price bar. It is possible that the news of NVDA’s recent correction will draw in more retail investors who saw NVDA soar from $100 to $140 but missed out. These investors may see this pullback as their second chance, supporting the price around these levels. If NVDA’s volume is high during a rebound, then that indicates that institutions may be on board with the trade too. In this scenario, NVDA could have the fuel needed to make another run to new highs. However, if the rebound rally quickly fails or occurs on light volume, then the stock may possibly test support at $115, $110, and even $100.
Now that this market Nephilim NVDA has corrected, its movements create implications for the broader market. The S&P 500 is still bounded by its extended Doji range. Presently, the S&P 500 is nearing support at 5445, with resistance residing at 5505. The troops (IWM) also remain in a trading range between 207 on the high end and 197 on the low end.
Grace and peace my friends,
BUFF DORMEIER, CMT®


Updated: 7/1/2024. Historical references do not assume that any prior market behavior will be duplicated. Past performance does not indicate future results. This material has been prepared by Kingsview Wealth Management, LLC. It is not, and should not, be regarded as investment advice or as a recommendation regarding any particular security or course of action. Opinions expressed herein are current opinions as of the date appearing in this material only. All investments entail risks. There is no guarantee that investment strategies will achieve the desired results under all market conditions and each investor should evaluate their ability to invest for the long term. Investment advisory services offered through Kingsview Wealth Management, LLC (“KWM”), an SEC Registered Investment Adviser.

