Volume Analysis | Flash Market Update 6.5.23
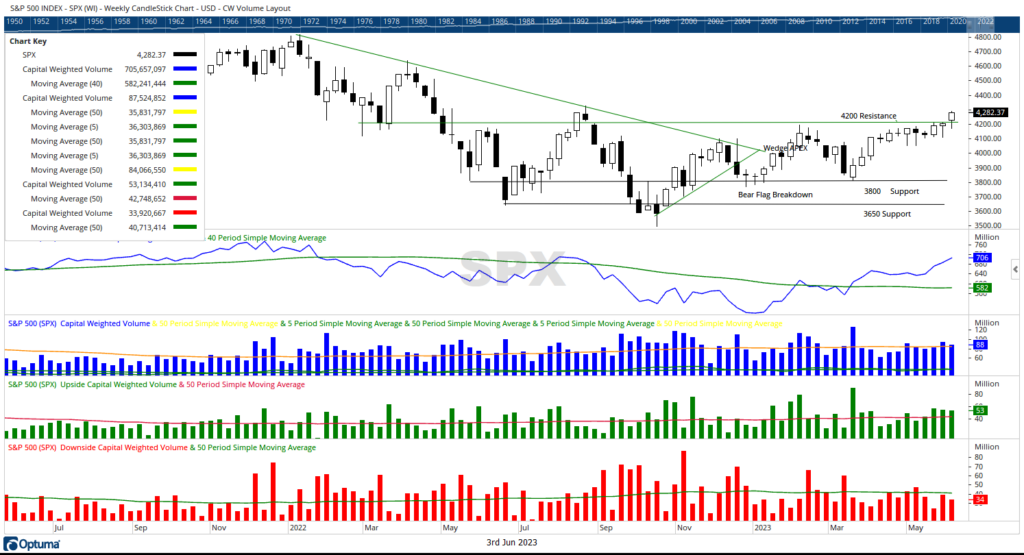
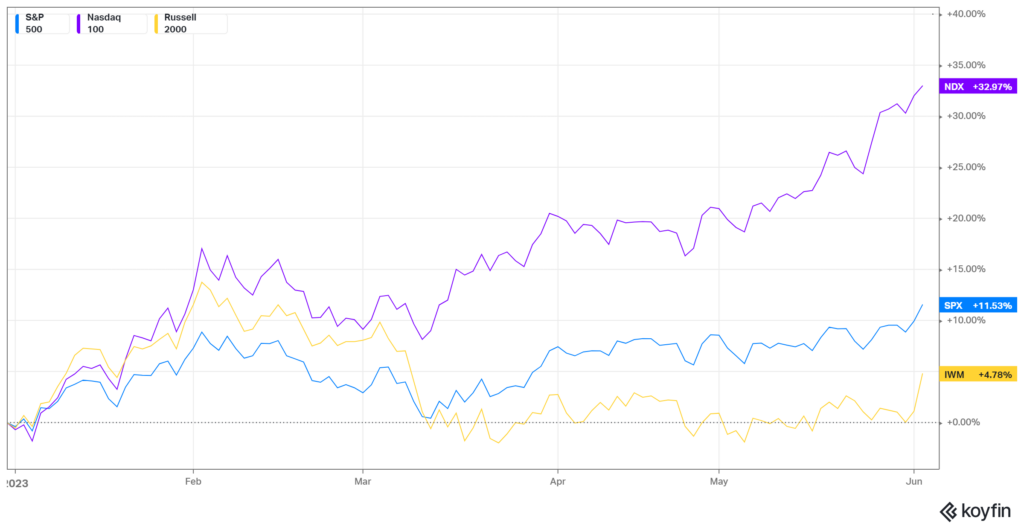
In last week’s edition of Volume Analysis, we concluded, “The resolution in a bifurcated market with the generals (NDX 100) advancing higher on positive capital flows with the troops (Russell 2000) declining lower has typically been for the generals to ‘rally up’ or pull up the rest of the broad market not receiving capital flows.” On Friday, that theme played out. The S&P 500 broke above the important 4225 resistance level, primarily led by the troops as opposed to the generals. For the first time in a long while, the Troops (Russell 2000) led the upside breakout up 3.63% compared to the Generals (NDX 100) advancing only 0.73% higher.
So far this year we have been discussing two major themes. One is the strong capital flows into the capital markets. Second is the concentration of this capital only flowing into a small number of stocks. Let’s start with discussing the second theme and how excessive and overdone that theme may now have become.
Take a look below at the top common contributors to both the SPX and the NDX 100 weightings as of May 31st. NDX 100’s and S&P 500’s highest capitalized stocks are both the same securities.
Stock SPX Weight YTD Return Through 5/31/2023
- AAPL 7.57% up 36.8%
- MSFT 6.99% up 37.6%
- AZMN 3.09% up 43.5%
- NVDA 2.76% up 158.9%
- GOOG/GOOGL 3.90% up 39.2%
- META 1.71% up 120.0%
Multiplying these multi-star generals’ weightings by their returns equates to a 14.72% attribution to the S&P 500! At the same time, the S&P 500 was up 9.65%. That means the rest of the S&P 500 without these six companies / 7 stocks (Alphabet has two stocks) is down -5.07%.
Another way to observe this phenomenon is by comparing the S&P 500 to the S&P 500 Equal Weight. The S&P 500 Index weights contributors by market cap illustrated earlier in our SPX general’s example. However, with the S&P 500 equal weight index, each stock holds the same weight, approximately 0.2%. As of Friday’s close, the S&P 500 is now up 11.14% whereas the RSP, Invesco’s S&P 500 Equal Weight ETF is up only 0.29%. According to market analyst David Aronson, CMT, this past week reached the most extensive divergence between S&P 500 and the S&P 500 Equal Weight Index ever. The only time it was even remotely close was in 1973.
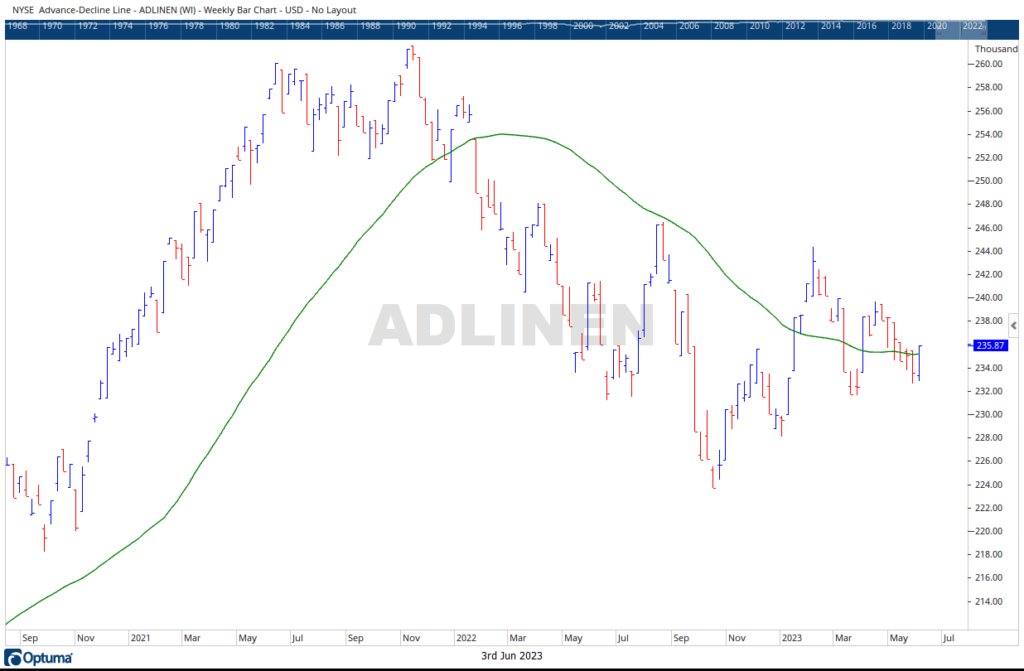
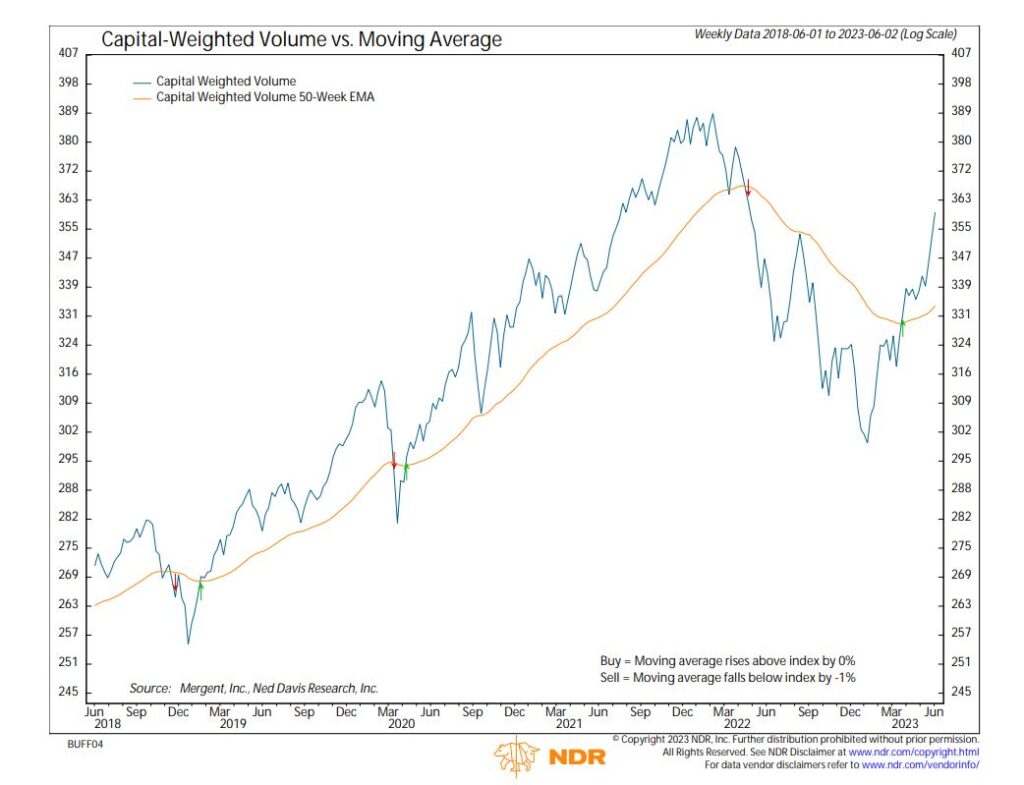
Going back to the first theme, capital flows, last week witnessed continued flows of capital into the S&P 500. Capital-Weighed Volume is now nearing all-time high territory, typically a very bullish indication. Overall, $53 Billion flowed into the market last week, whereas $34 Billion flowed out. However, with Friday’s rally, the attribution was much more spread out between the generals and troops than most of the year. Also, with the boost of Friday’s bullish action, the NYSE AD Line was once again able to break the above trend.
Now that the debt ceiling circus show is over, this is the time of year when counter trends may develop. Yet in the primary trend, capital continues to flow positively into stocks. Perhaps the concentration of capital into the big names has become overly ripe and it may be time for a more inclusive market to take hold.
Grace and peace my friends,
BUFF DORMEIER, CMT®
Updated: 6/5/2023
Historical references do not assume that any prior market behavior will be duplicated. Past performance does not indicate future results. This material has been prepared by Kingsview Wealth Management, LLC. It is not, and should not, be regarded as investment advice or as a recommendation regarding any particular security or course of action. Opinions expressed herein are current opinions as of the date appearing in this material only. All investments entail risks. There is no guarantee that investment strategies will achieve the desired results under all market conditions and each investor should evaluate their ability to invest for the long term. Investment advisory services offered through Kingsview Wealth Management, LLC (“KWM”), an SEC Registered Investment Adviser.