Volume Analysis ‘Flash Market Update’ – 12.4.23
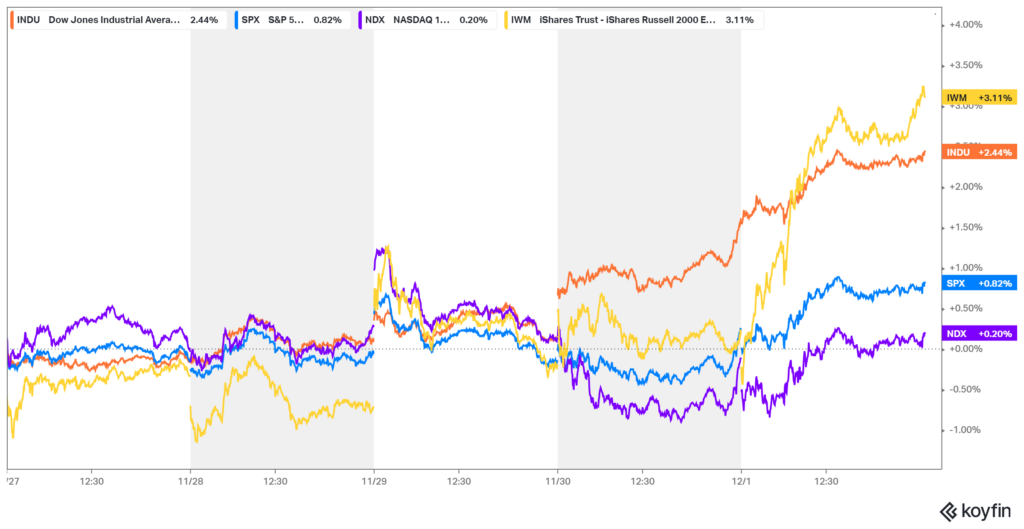
S&P 500 capital flows concluded the week on a downward trajectory, notwithstanding the S&P 500 index’s 0.82% uptick. Capital outflows exceeded inflows, with $42.7 billion exiting compared to only $38.1 billion of incoming capital. The generals (NDX 100) took a breather, concluding the week with a 0.20% gain. Conversely, the previously struggling troops (IWM) continued their late fourth-quarter surge, finishing the week up 3.11%.
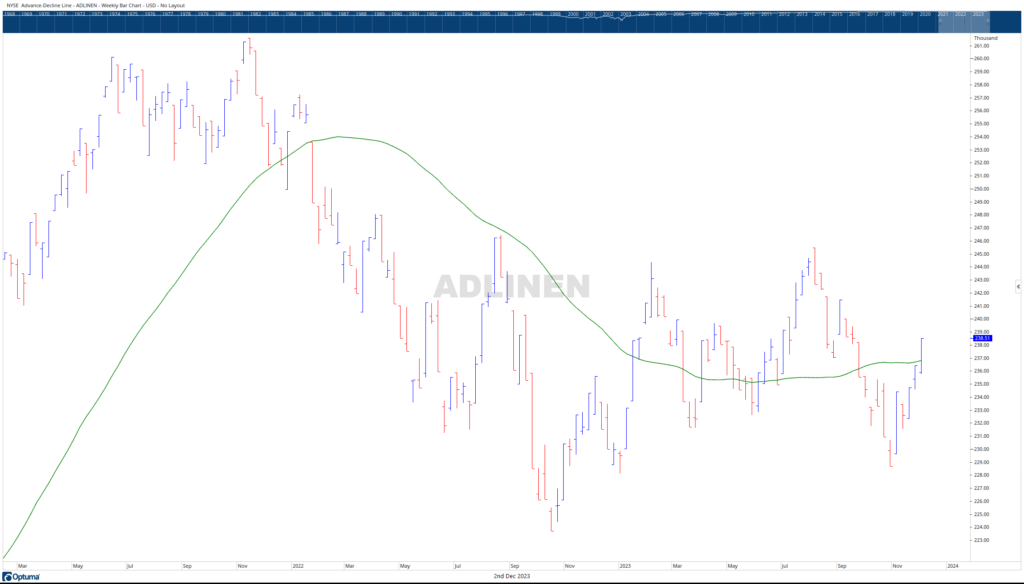
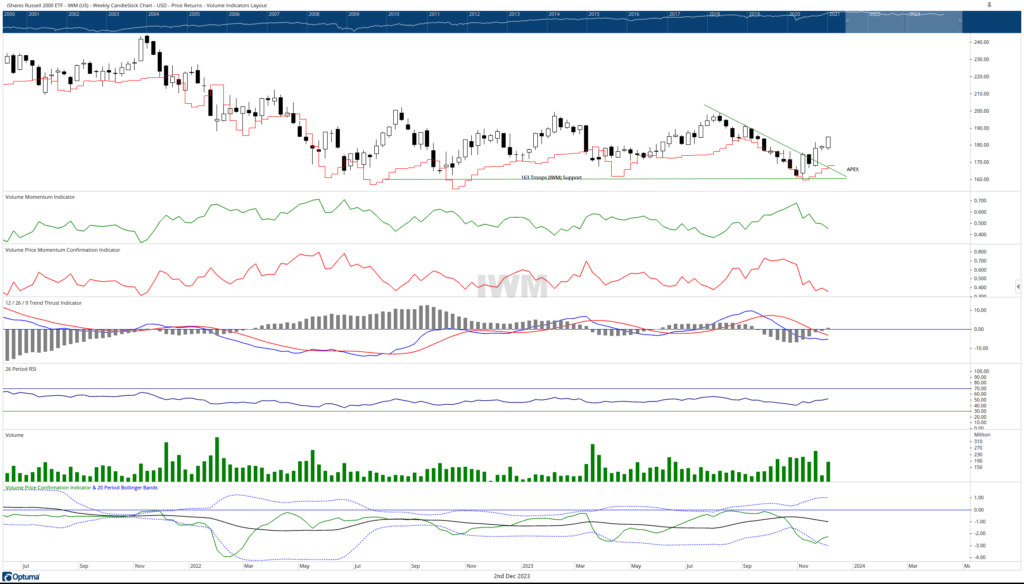
In our November 20th edition, we highlighted the breakout of IWM to the upside from a well-established descending triangle pattern. We remarked, “Despite recent fluctuations in the troop’s performance, there may be a positive development on the horizon. The breakout (IWM) bounce against long-term support observed last week may signify the formation of a rare bullish descending triangle. Typically considered a bearish formation, the crucial factor lies in the direction of the move at the apex, whether it’s a breakout or breakdown with high-volume conviction. In the case of the IWM, it broke above its downtrend on significant volume. Moreover, this move was substantiated by positive breadth, with the Advance-Decline Line surpassing its previous near-term range.”
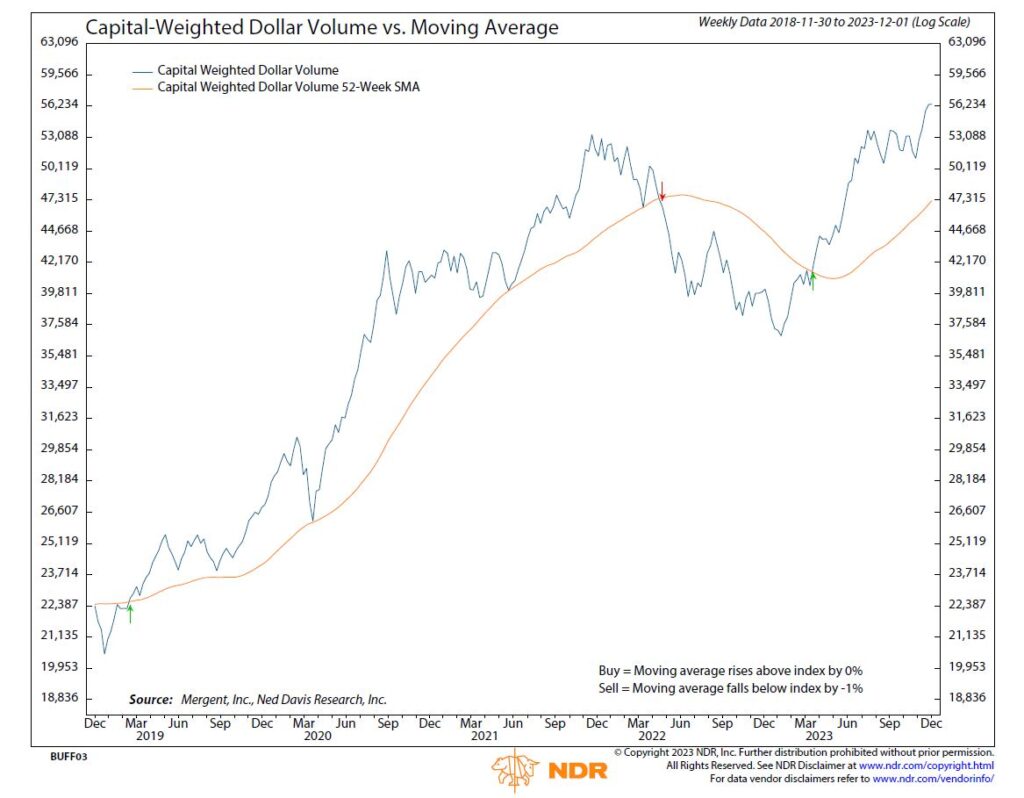
As previously noted, this move may be aligned with the decline in the yield of the 10-year treasury bond, creating a potentially bullish backdrop for many stocks. While I might usually be skeptical of an upmarket influenced by inverse S&P 500 capital flows, Capital-Weighted Volume has surged to new all-time highs. Additionally, positive action in breadth, particularly in small caps, suggests a possibly healthy market condition. Year to date through December 1, 2023, the S&P 500 has gained 21.52%, whereas the S&P 500 equal-weighted index has only risen by 8.18%, while the Dow Jones US Select Dividend Index is down -2.34%. The recent apparent mean reversion signals a potential shift of capital inflows from the “magnificent 7” mega caps back to the broader market.
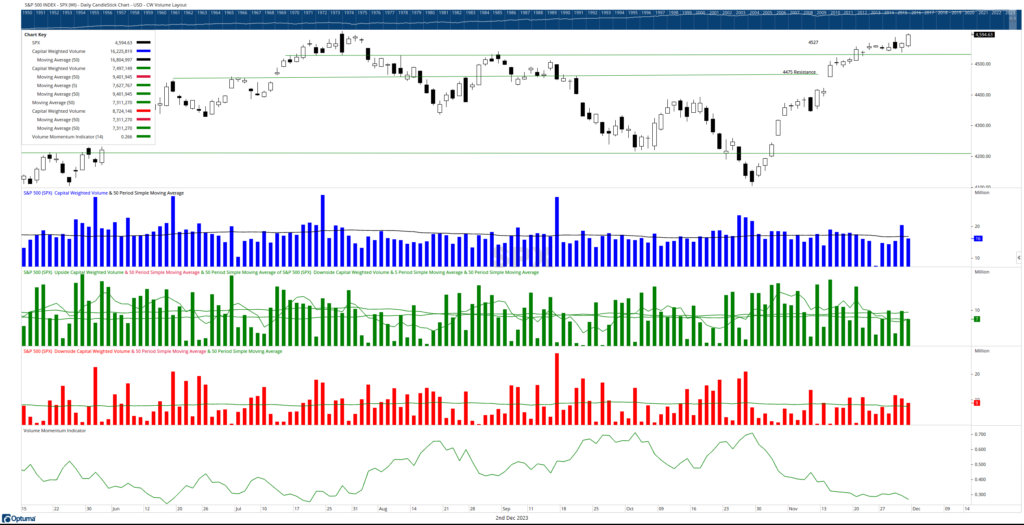
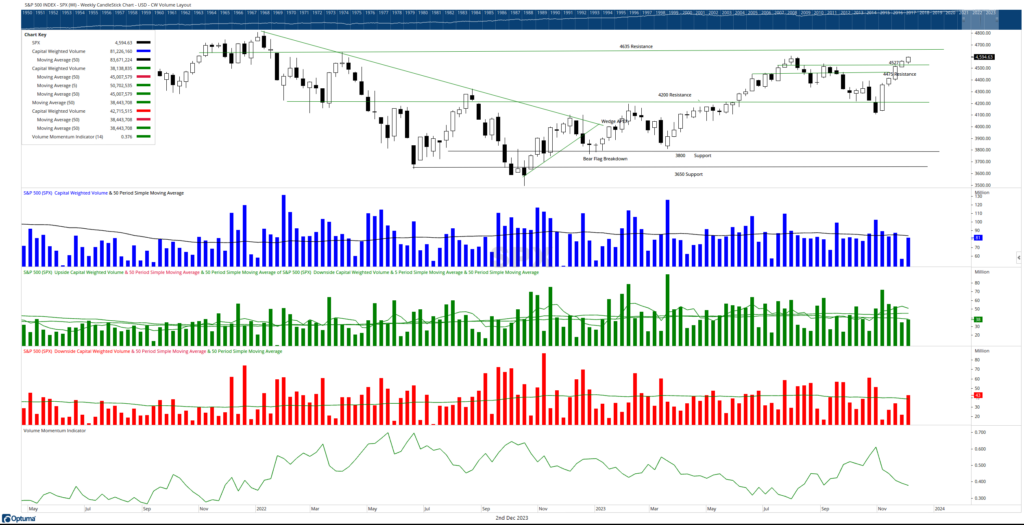
Minor S&P 500 resistance is found in the range of the July highs at 4607, with more significant intermediate resistance at 4635. Meanwhile, minor short-term support rests at 4527, intermediate support at 4475, and major S&P 500 support at 4200. Despite this week’s slightly negative capital flows, Capital-Weighted Dollar Volume is just below its all-time highs, leading all indicators higher. Capital Weighted Volume is reaching new all-time highs, and market breadth is steadily improving. This evidence suggests that Santa may bring the bulls Christmas cheer.
Grace and peace my friends,
BUFF DORMEIER, CMT®


Updated: 12/4/2023
Historical references do not assume that any prior market behavior will be duplicated. Past performance does not indicate future results. This material has been prepared by Kingsview Wealth Management, LLC. It is not, and should not, be regarded as investment advice or as a recommendation regarding any particular security or course of action. Opinions expressed herein are current opinions as of the date appearing in this material only. All investments entail risks. There is no guarantee that investment strategies will achieve the desired results under all market conditions and each investor should evaluate their ability to invest for the long term. Investment advisory services offered through Kingsview Wealth Management, LLC (“KWM”), an SEC Registered Investment Adviser.