Portfolio Manager Insights | What the Swing to Economic Growth means for Investors and the Fed 11.2.22

Major stock market indices have rebounded in October as investors hope for a slowdown in the pace of Fed rate hikes. As of Friday, October 28, the S&P 500 had gained 8.8% over the month and its year-to-date loss was cut to 18%, just slightly better than bear market levels. The Dow is now above correction territory with a 9.6% year-to-date decline while the Nasdaq, consisting of hard-hit tech stocks, gained 5% in October to reach a year-to-date pullback of 29%. This occurred despite a jump in interest rates with the 10-year U.S. Treasury yield rising above 4%. What’s driving optimism in markets and how should long-term investors maintain perspective?
The economy grew in the third quarter after a tough first half of the year

Important economic data released over the past week shed light on how businesses and households are doing in this challenging inflationary environment. After the economy shrank slightly the first half of the year, declining 1.6% and 0.6% in the first and second quarters, respectively, the Gross Domestic Product (GDP) report for the third quarter showed a swing to growth of 2.6% (these are quarter-over-quarter seasonally adjusted annual rates that account for inflation). This exceeds economists’ prior estimates of 2.4% and softens concerns that we may already be in a recession. While GDP is backward looking and reflect many factors that are already known, this is nonetheless a welcome sign.
While this growth rate is nothing to write home about and doesn’t change the fact that many parts of the economy are struggling, it is still positive and helps to provide perspective. The poor GDP numbers earlier this year were nowhere close to the initial stages of the pandemic, when GDP fell 30% at an annualized rate, or during 2008 when the financial system was on the brink of collapse. The chart above shows the wide range of economic growth rates since World War II and how moderate recent numbers have been despite the level of investor concern. It’s also important to keep in mind that across history, recessions occur periodically and serve as an “economic reset,” paving the way for future growth.
Consumer spending is robust but rate-sensitive sectors are struggling
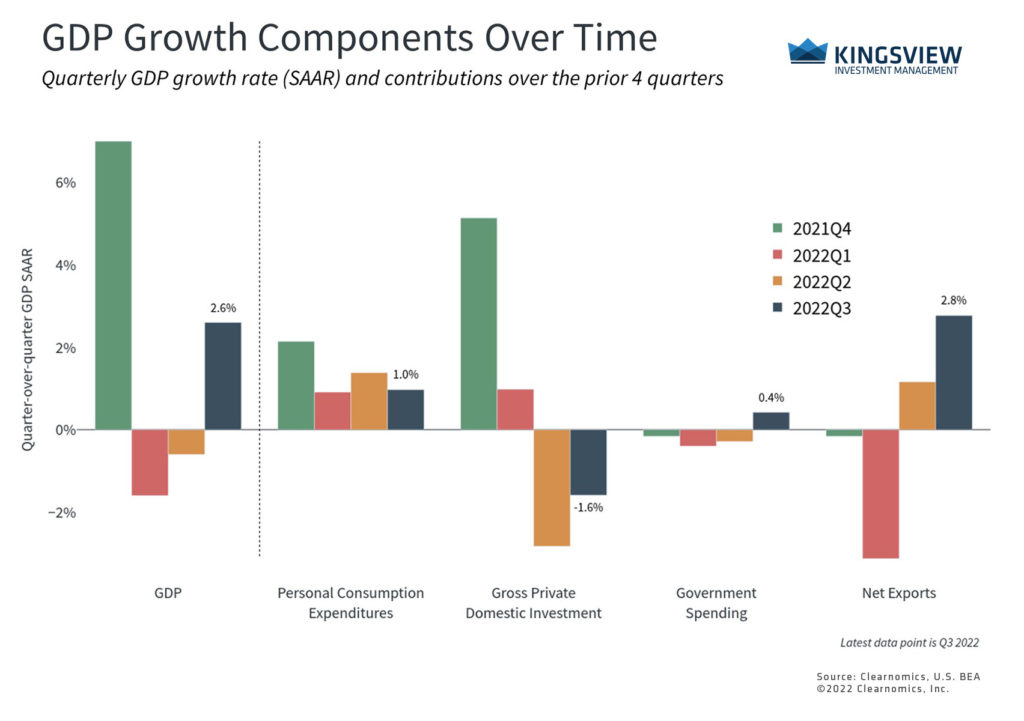
The details of the GDP report show that consumer spending decelerated but still contributed one percentage point to growth. Gross private domestic investment fell last quarter due largely to a struggling housing market, reducing headline GDP by 1.6 percentage points. This is consistent with rising rates and softening demand leading to the largest decline in the Case-Shiller housing index since the 2008 housing crisis.
Beyond housing, business spending on equipment and intellectual property investment added about half of one percent to GDP. Government spending rose slightly, contributing 0.4%. Finally, rising exports paired with a reduction in imports buoyed production for the third quarter despite the strengthening U.S. dollar. This shift in the trade numbers reverses the biggest driver of negative growth in the first quarter, highlighting how much these numbers can change from quarter to quarter.
The natural question for investors is how positive economic numbers impact Fed rate decisions. Good news can often be interpreted as bad news by the market since it could be evidence that the economy can withstand higher rates as the Fed combats inflation. Thus, the Fed may be able to increase interest rates with a lower risk of inducing a recession, especially with the reported unemployment rate still so low. This struggle with interpreting the data, and trying to predict what the Fed may do next, is what has caused markets to swing all year. In fact, this occurs every rate hike cycle and actually began last year as the Fed began to “taper” its asset purchase program.
Fed rate expectations have fallen, boosting markets
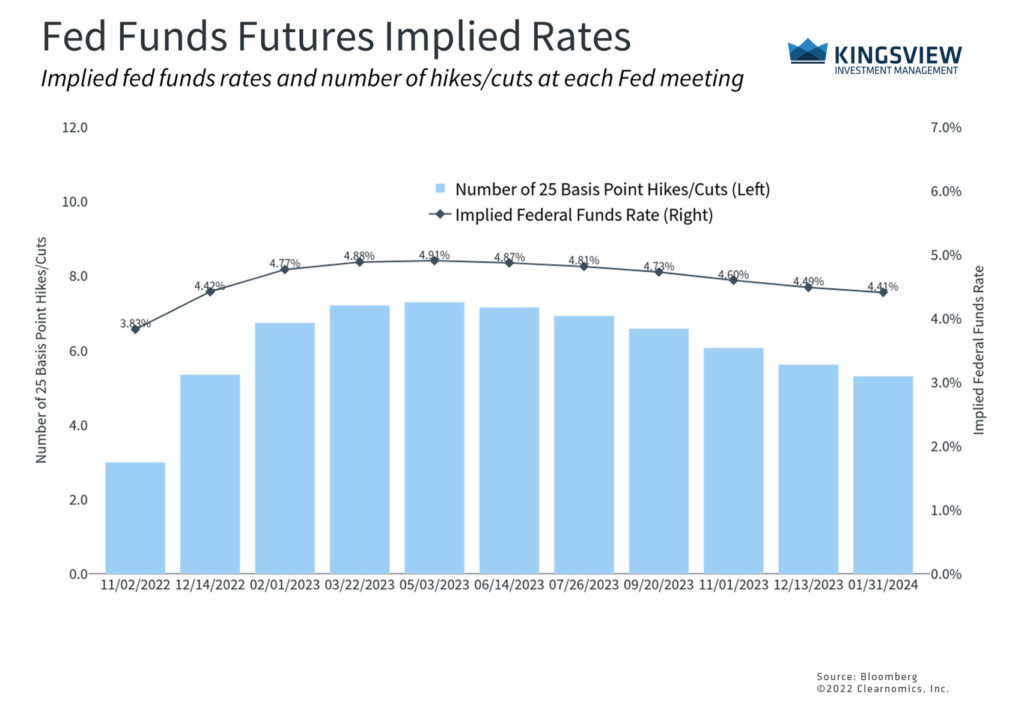
The irony is that the recent market rebound has been driven by the hope the Fed may begin to slow its pace of rate hikes, despite the positive economic numbers. The chart above shows that the market anticipates the Fed will raise rates to around 4.75% to 5% by mid-2023, a slight decline from previous expectations. This is partly based on the comments of some Fed officials who argue for “front-loading” rate hikes and measuring their effects over time. So far, investors, economists and the Fed have all been overly optimistic about both inflation and the path of rate hikes, forcing upward adjustments to these numbers throughout the year.
While falling inflation and a reversal in Fed policy would be a welcome sign were they to occur, it’s important for long-term investors to maintain a level-headed view of the data to avoid swinging between the manic pessimism and optimism of the market. There are still many short-term questions on how this part of the business cycle will play out and whether strong economic data is bad for markets. However, in the long run, markets tend to follow economic growth and corporate earnings. Focusing on years and decades, rather than days or months, can help to properly guide investors toward their financial goals.
The bottom line? The latest GDP numbers show that there are still bright spots in the economy, despite the many challenges with inflation. Investors ought to stay invested rather than focus too much on each data point and Fed decision.