Volume Analysis | Flash Update — 3.20.23

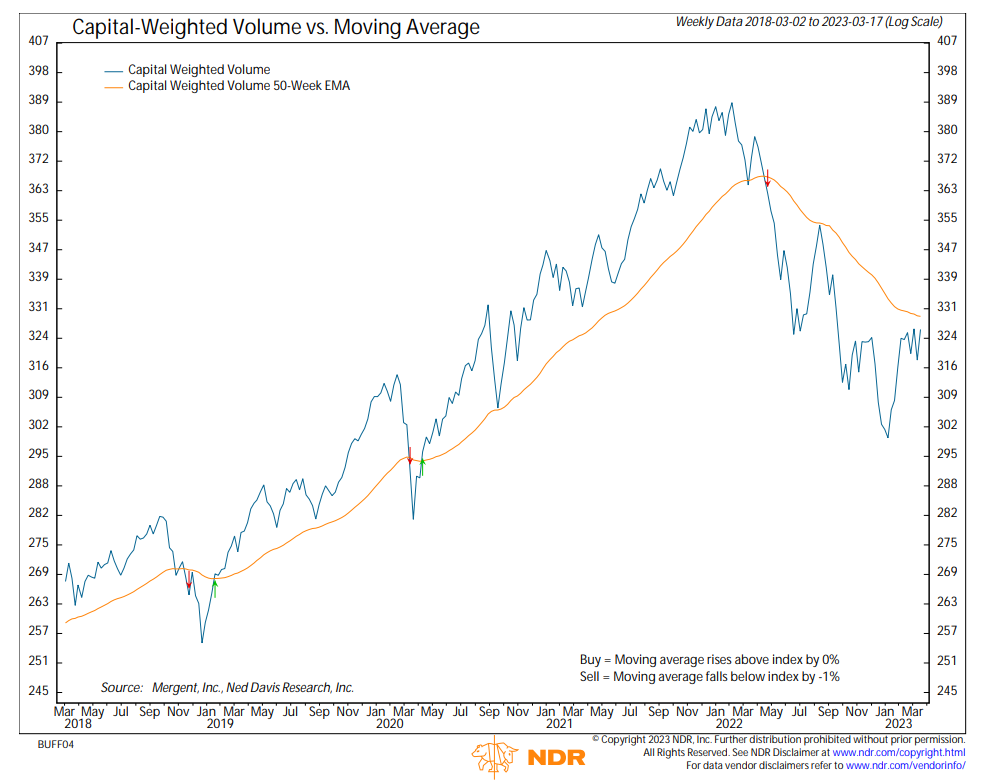
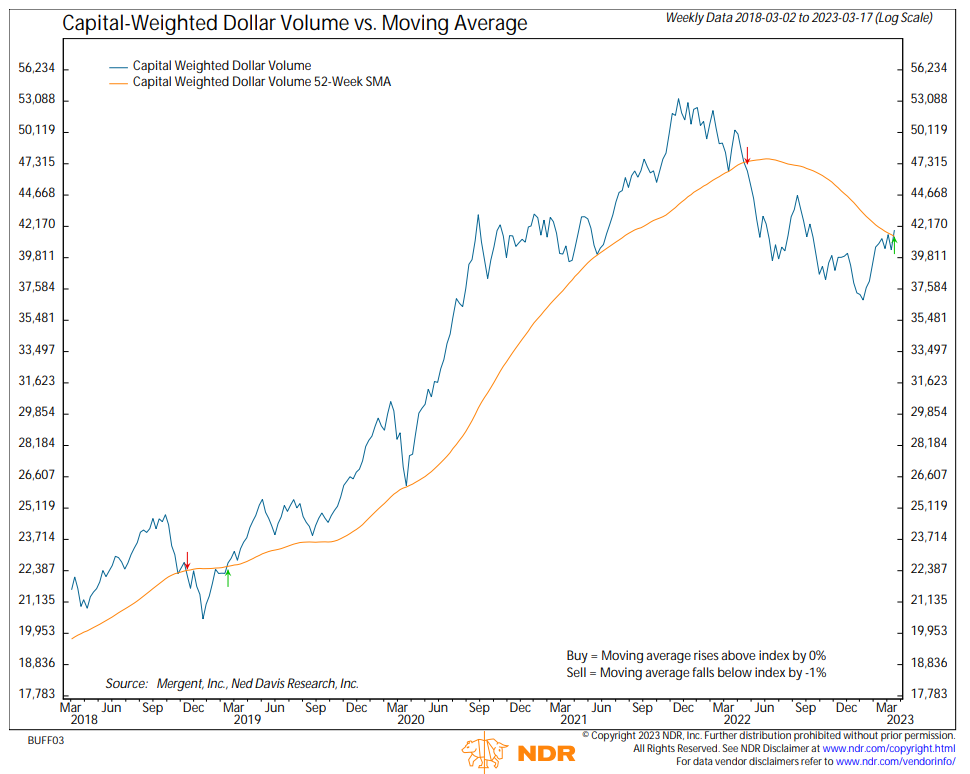
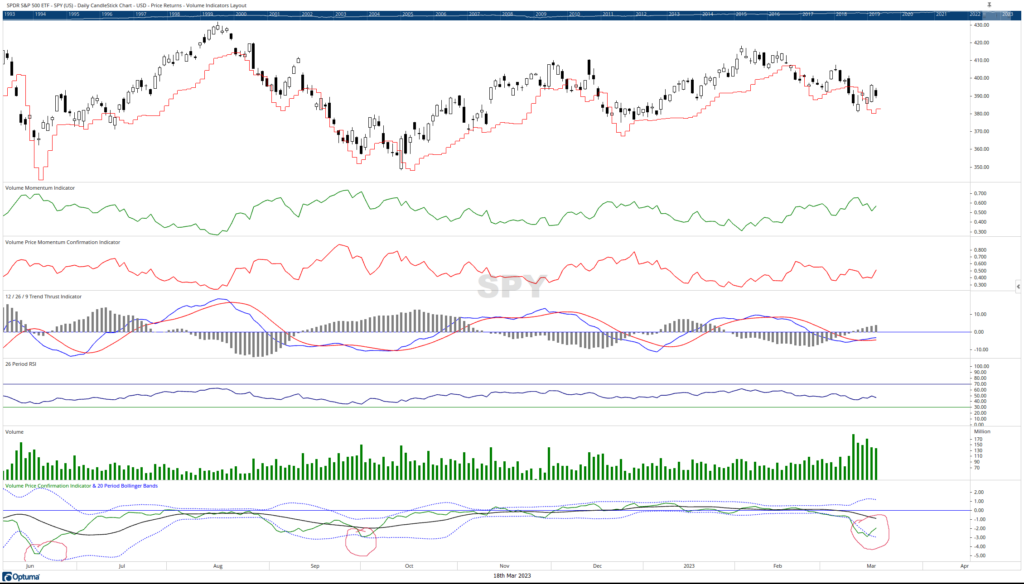
Last week’s data was very interesting. Forget the headlines, I am referring strictly to the data. In a previous discussion, we talked about Capital Weighted Dollar Volume testing resistance suggesting a possible market pivot in either direction. In last week’s issue of Volume Analysis Weekly, we declared that “this past week provided a clear message as the market dropped when testing capital-weighted dollar volume resistance.” Yet, this past week Capital Weighted Volume surged above the trend, indicating a Volume Analysis Bull Market based on capital flows. The S&P 500’s capital inflows were $90 Billion, the highest inflows in nearly ten years. Capital outflows totaled $36 Billion which is not a light number either. Together, the total Capital Weighted Volume was the largest since March 2020 at the onset of the pandemic.
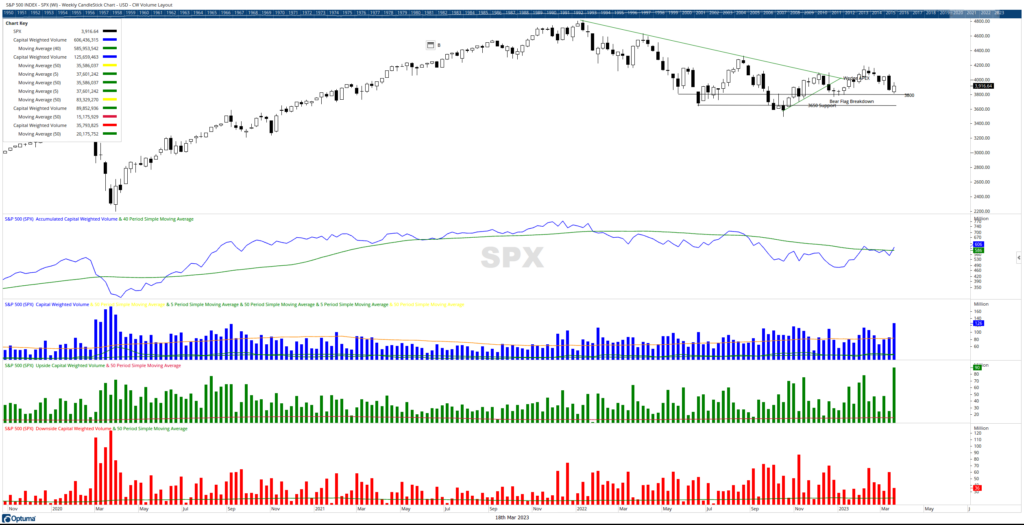
We further stated last week, “The SPY experienced strong outflows, which is evident from the surging downside volume causing the SPY VPCI to fall more than two standard deviations below its Bollinger Band. This strong downward movement could indicate a blowoff by fickle retail investors. If the VPCI continues to drop lower, it could possibly drop deep enough to set up our VPCI V-bottom conditions once again.” On Thursday, March 16th, a shallow VPCI V Bottom formed as the VPCI rose to turn above its lower standard deviation band. That stated, the VPCI level was not low enough to trigger an official deep VPCI V Bottom. According to VPCI V Bottom research, the lower the VPCI reading prior to the VPCI upturn, the higher the historical probability of a temporary bottom. An official deep VPCI V bottom is triggered at a low VPCI reading of -4 or lower. Thursday’s VPCI only reached -2.9, still a very low reading.
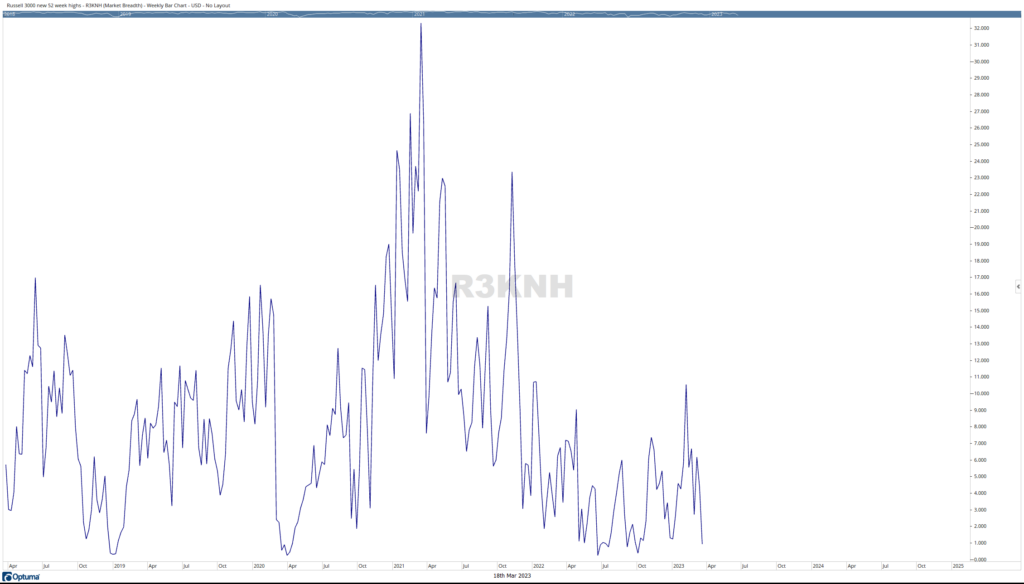
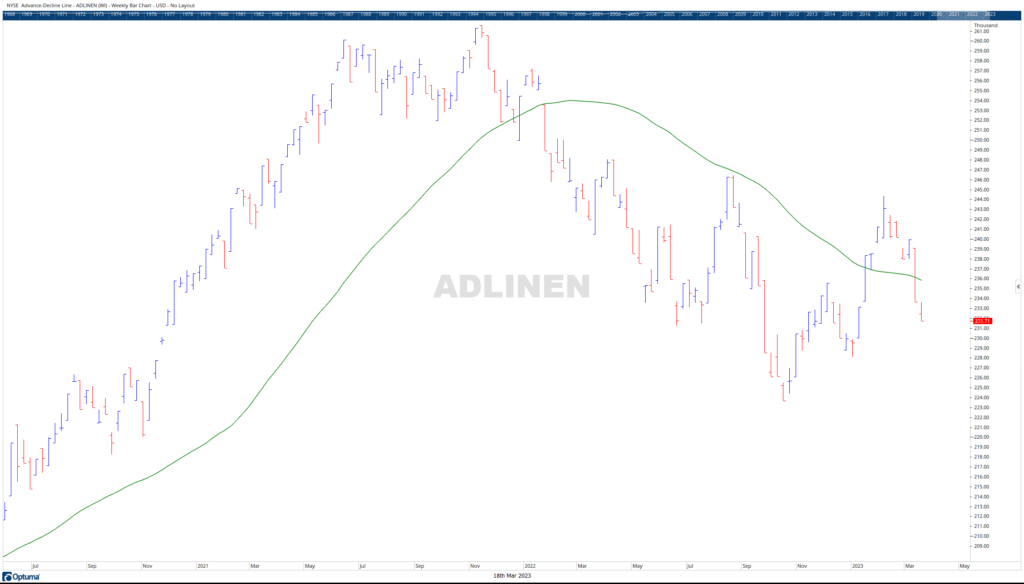
Not all of last week’s data was bullish though. Both the Advance-Decline Line and the number of stocks making new highs continued to drop lower. This is indicative of a market that may be beginning to bifurcate. Market bifurcation is further evidenced by the Nasdaq 100 closing up approximately 5.75%. Meanwhile, the S&P 500 was only up nearly 1.5%, the DOW was almost flat, and the Russell 2000 was down nearly 3% for the week. The “generals” are the largest capitalized stocks in the market. Presently, the generals are primarily weighted in technology stocks such as Apple, Microsoft, Alphabet, Meta, and Amazon. These big growth companies are surging in capital inflows while the mid and small-capitalized stocks, “the troops”, are not following and in the majority of the cases, retreating. Overall, capital is moving back into the market. However, the inflows are concentrated amongst the large caps and specific sectors, not the broad market. The return of capital to the growth sectors could indicate the market is expecting a return to easy monetary policy whereas the flight of capital and liquidity from the small and mid-sized and value stocks could suggest investors have concerns about the state of the underlying economy. The generals are leading a strong charge. Will the troops begin to follow?
Grace and peace my friends,
BUFF DORMEIER, CMT®
Updated: 3/20/2023
Historical references do not assume that any prior market behavior will be duplicated. Past performance does not indicate future results. This material has been prepared by Kingsview Wealth Management, LLC. It is not, and should not, be regarded as investment advice or as a recommendation regarding any particular security or course of action. Opinions expressed herein are current opinions as of the date appearing in this material only. All investments entail risks. There is no guarantee that investment strategies will achieve the desired results under all market conditions and each investor should evaluate their ability to invest for the long term. Investment advisory services offered through Kingsview Wealth Management, LLC (“KWM”), an SEC Registered Investment Adviser.