Portfolio Manager Insights | What Seasonal Patterns Like “Sell in May” Mean for Investors — 5.6.26

The human brain is excellent at finding patterns, a skill that has evolved to help us across many parts of life. However, it can also lead us astray when there is no real pattern at all, such as when we see shapes in clouds and ink blots. When it comes to investing, this is relevant because some patterns are important, such as the long-term relationship between the market and the economy, while others may be due to pure coincidence. Distinguishing between what makes for interesting trivia versus true investing principles is a challenging but important part of achieving long-term financial success.
It’s not surprising that investors have identified many calendar and event-based patterns, including “sell in May and go away,” the January Effect, the Santa Claus rally, the Super Bowl indicator, and more. After all, even when flipping a coin, you would expect streaks of several heads or tails in a row due to pure chance. To better understand these effects, the key is to separate random noise from knowledge of how financial markets truly function.
Many famous seasonal patterns have shifted over time
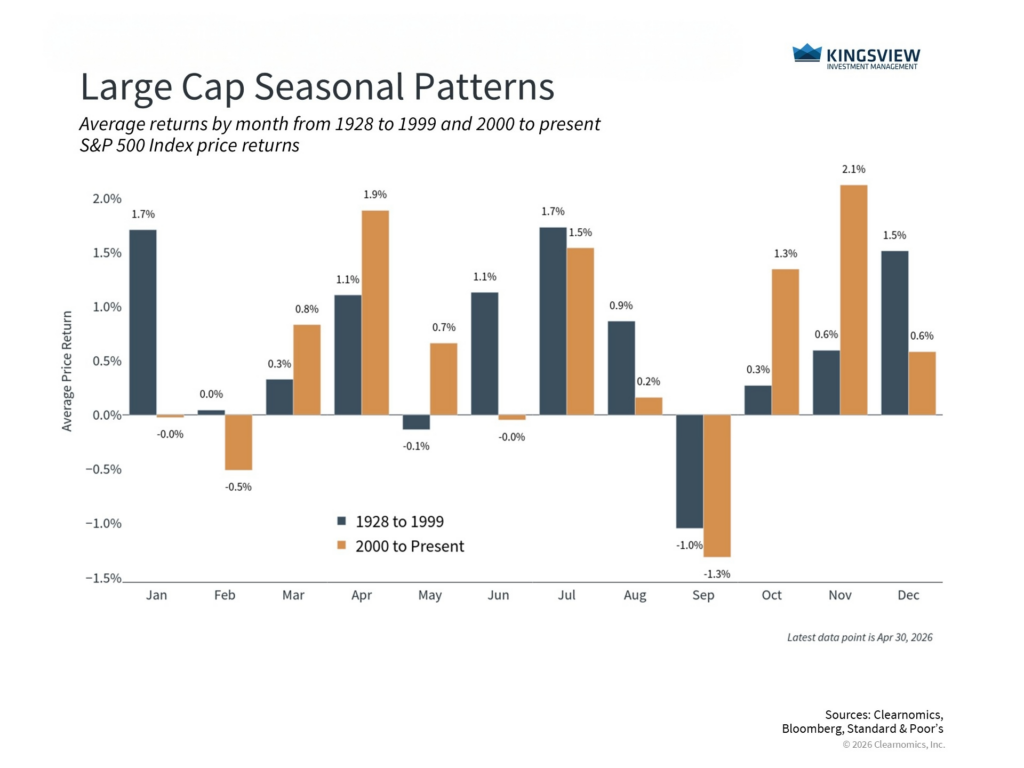
There are many market patterns, but it’s helpful to review seasonal trends as a whole. The chart above breaks out the S&P 500 into two distinct periods – from 1928 to 1999 and from 2000 to today. In the 20th century, it was indeed the case that some months were negative on average, while some were strongly positive. For instance, May and September experienced declines of 0.1% and 1% on average, while December and January experienced significant positive returns. It’s easy to see that the market has not behaved the same each month, so it’s tempting to wonder if we can simply invest during positive periods.
These observations have fueled concepts such as “sell in May,” the idea that the six-month period leading up to May experiences better returns than the other half of the year. However, since 2000, many of these months have actually generated positive average returns, reversing this earlier pattern. This may be because investors behaved differently after identifying this trend, something structurally changed in the market or the law, or because it never truly existed at all.
What should investors make of this? It’s commonly said that the simplest explanation may be the best. So, this concept is often described as being “fooled by randomness,” distinguishing the signal from the noise, and other similar concepts. Because stock market returns are difficult to predict, any historical stretch will naturally contain periods that look better or worse than others. This does not necessarily mean there is an underlying reason for those differences, or that they will continue. After all, just as we can see objects in clouds, we can find interesting patterns even in a completely random dataset.
In statistics and economics, researchers use the concept of “statistical significance” to try to distinguish between patterns that could be real, and those that are coincidental. It’s also important to distinguish causation from correlation, i.e., whether there is something unique to a particular calendar month driving these patterns, or if events simply happened to take place during those months. For investors, these concepts matter because a pattern that emerged by chance, or that was tied to a specific historical era, can be interesting, but offers little guidance for the future.
Small caps tell a similar story as the market has evolved
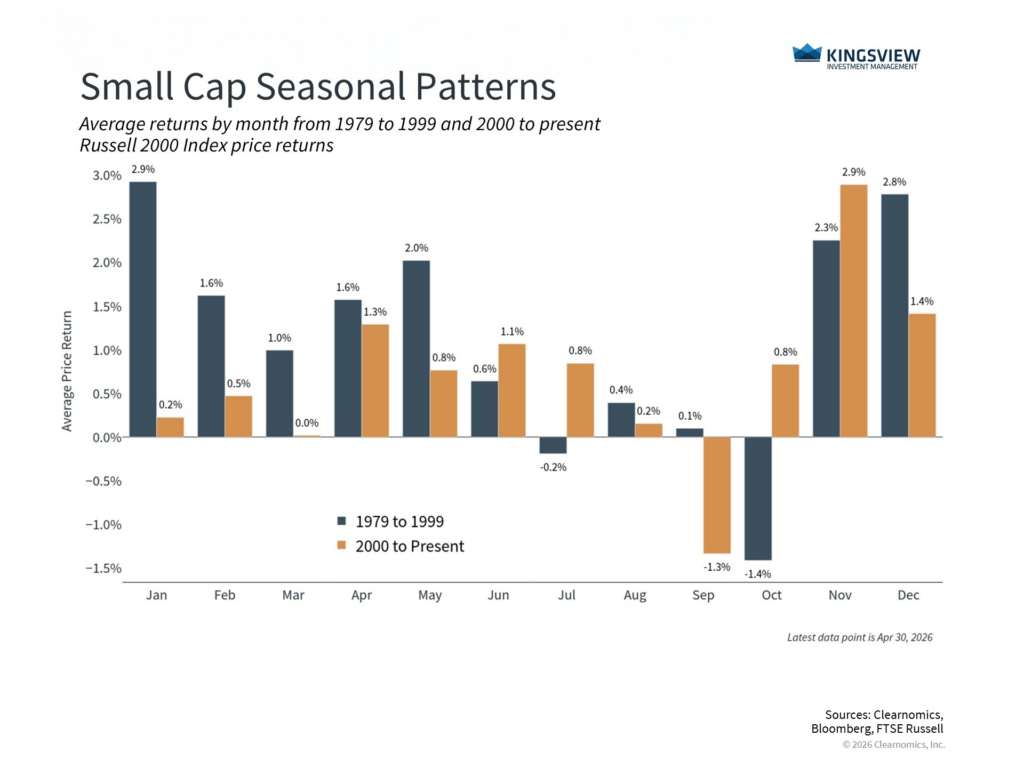
Small cap stocks have also shown unique seasonal tendencies over the years, but the same principles apply. In fact, the original research in the 20th century on the January Effect, the idea that January experiences a jump in stock prices on average, focused primarily on small caps.
There have been many possible explanations for this effect that have been explored by academics. These include tax loss harvesting, in which investors sell stocks for tax purposes and buy them again in January, households investing holiday bonuses in January, window dressing, where portfolio managers sell stocks in December and buy again in January so they don’t appear in annual reports, and many more. Whatever the reason, the January Effect has mostly disappeared in the period since then.
One observation that does stand out across both large and small cap data since 2000 is that September has tended to be a difficult month. At first glance, this might seem like a real seasonal effect. However, this is heavily influenced by a few extreme events, including the dot-com bust, the 2008 financial crisis, and the 2022 bear market due to inflation. These outliers occurred not because it was September, but because of underlying market and economic factors.
Investors should focus on long-run trends instead
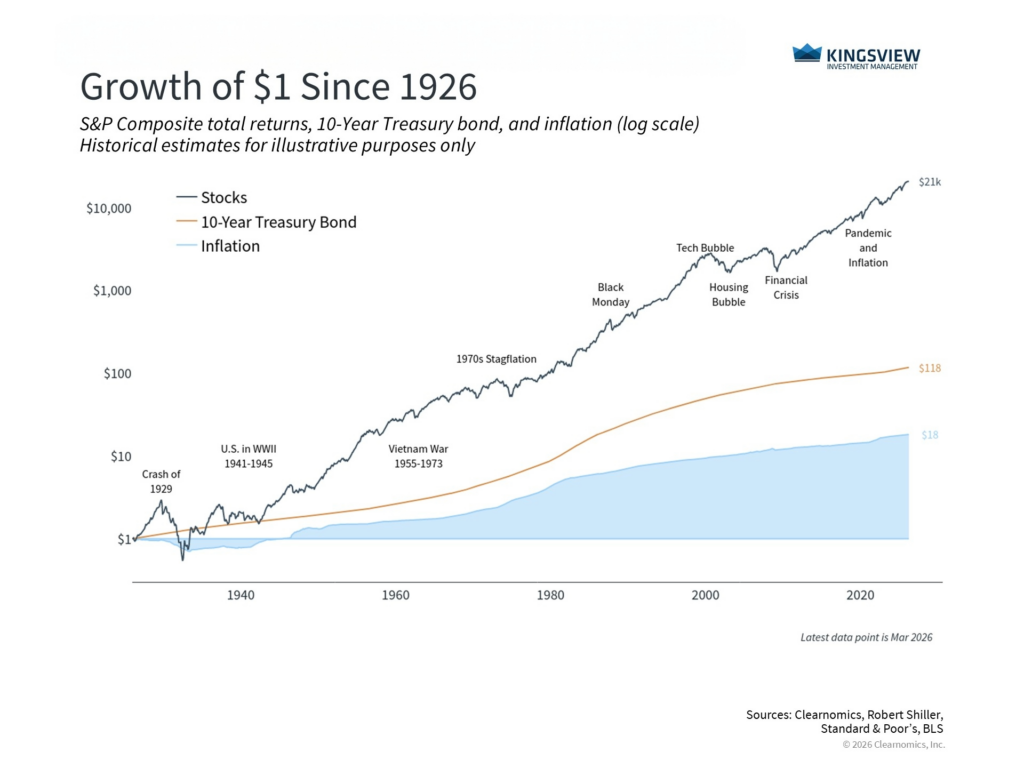
This is why investing principles that have stood the test of time are built not on surface-level patterns, but instead on the underlying drivers of long-term market returns. The reason that the S&P 500 has historically performed well despite wars, recessions, financial crises, pandemics, and countless periods of uncertainty, is not just that markets go up over time.
Instead, it’s because business cycles spur corporate investment and consumer spending, which in turn drive corporate earnings, supporting the stock market and portfolios. The accompanying chart demonstrates this underlying trend over the past century. Staying invested across asset classes such as stocks and bonds has not only kept up with inflation, but far surpassed it.
The past is no guarantee of the future, there can be challenging short-term periods, and any particular month in a given year can be positive or negative. The temptation to time the market, whether by trading daily price movements or by following seasonal rules of thumb, is natural and understandable. After all, if there were a few simple patterns that worked, it would be much easier than staying disciplined, saving steadily, and sticking to a financial plan. However, the fact that doing these things is hard is exactly why they are rewarded in the long run.
The bottom line? Seasonal patterns like “sell in May” have changed over time. Rather than focusing on surface-level patterns, investors should stay positioned for the long-term market and economic trends that increase the odds of financial success.